Annual Recurring Revenue is transforming the way SaaS companies measure their performance and appeal to investors. This fundamental metric not only determines your valuation, but also guides your most important strategic decisions. In recent years, organizations that have perfectly mastered this calculation have achieved 15-20% higher valuations when raising capital.
This guide will help you :
- Master calculations with precision and avoid costly errors
- Optimize your recurring revenues with today’s best practices
- Use the right tools to monitor and analyze your progress
- Present your results convincingly to investors
- Developing a strategy based on reliable data
Sommaire
Definition and principles of Annual Recurring Revenue
Annual Recurring Revenue simply measures the annual value of all your current recurring subscriptions. This metric captures only revenue from recurring subscriptions, excluding all one-time fees and non-recurring services.
The fundamental principles are based on three pillars: contractual recurrence, cash flow predictability and the measurement of organic growth. Unlike traditional sales, this approach smoothes out seasonal variations and offers a clear vision of your development trajectory.
What sets this metric apart is its exclusive focus on contractually guaranteed, recurring revenues. It therefore excludes installation fees, one-off consulting services, training or any other non-recurring revenue. This fundamental distinction ensures that your metric accurately reflects the health of your subscription model.
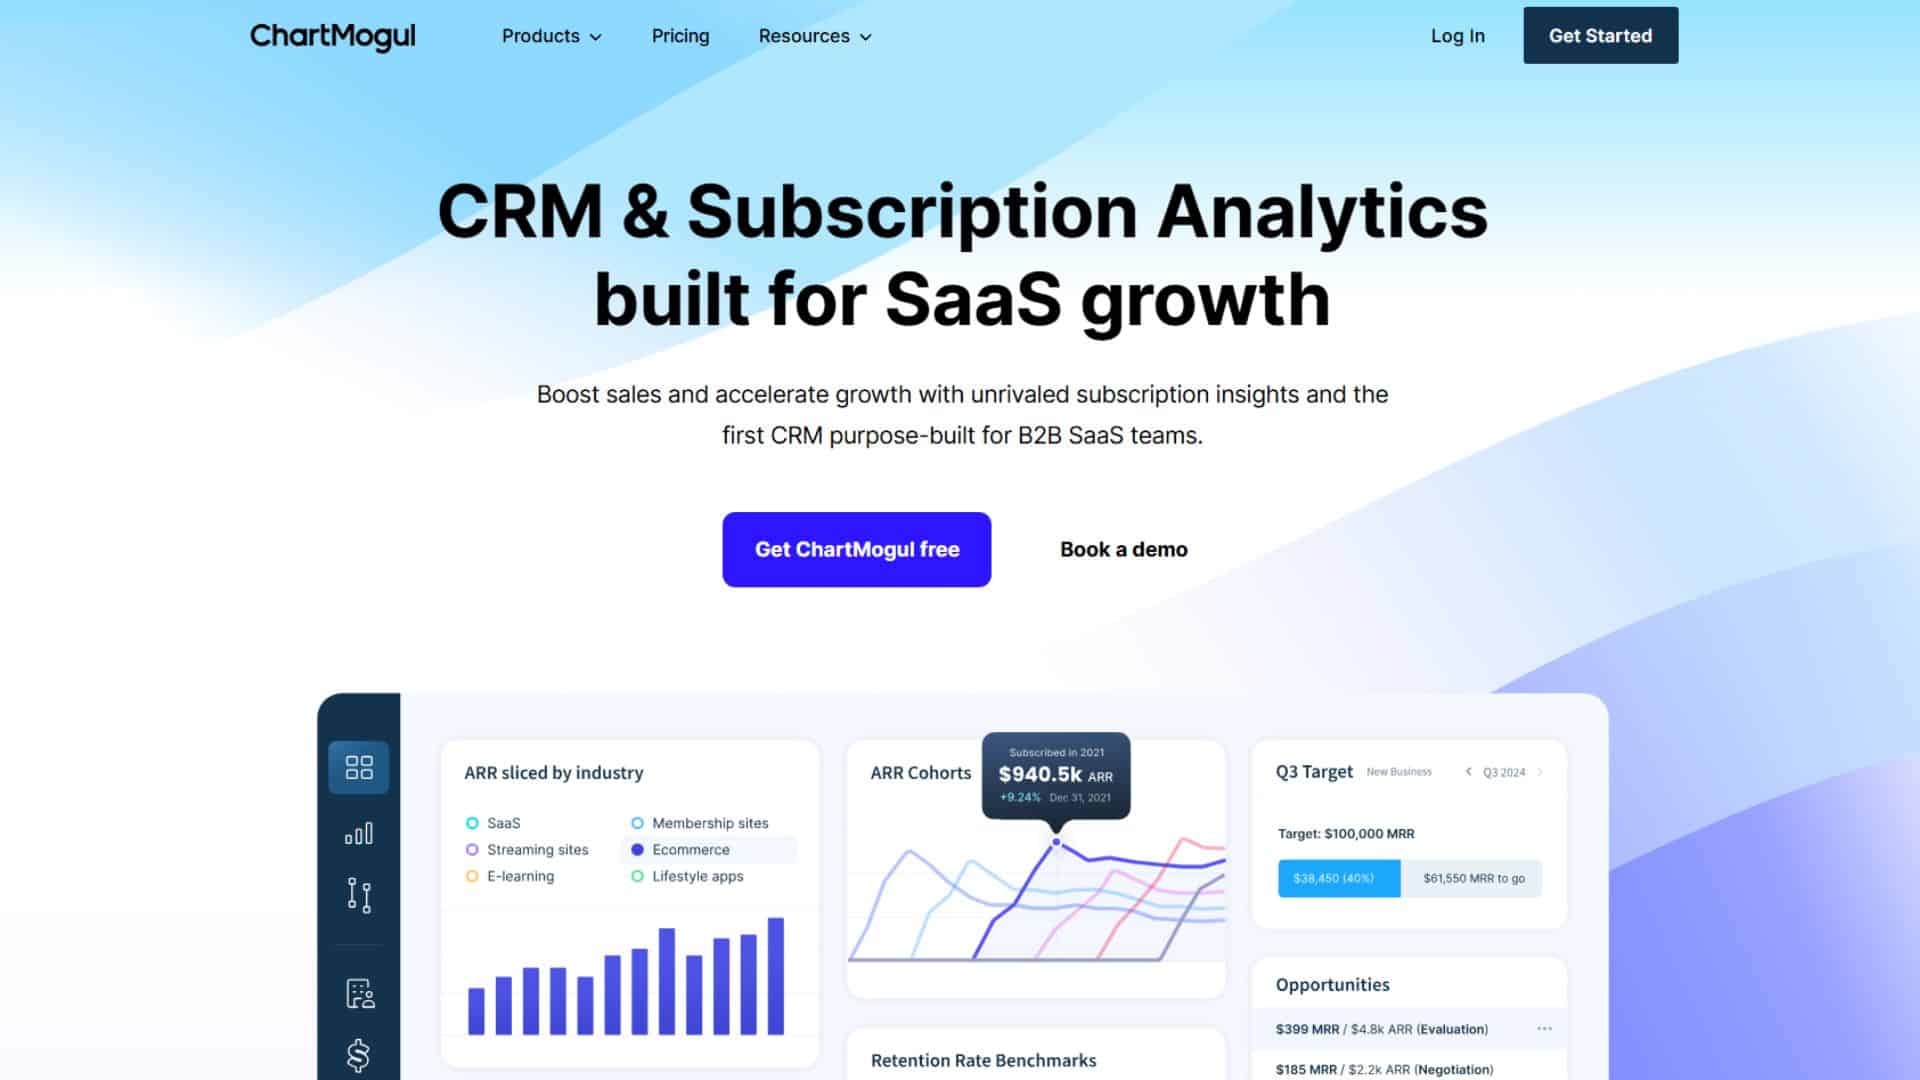
According to ChartMogul, world leader in SaaS analytics, this metric can be defined in two main ways. The first, traditional approach, considers only contractual revenues with a service duration of one year or more. The second, more modern and widely adopted approach, involves annualizing Monthly Recurring Revenue (MRR) by multiplying it by 12.
Difference between ARR, MRR and total income
The distinction is a fundamental technical aspect that every manager needs to master. Monthly Recurring Revenue measures recurring income on a monthly basis, offering operational granularity for day-to-day adjustments. ARR, on the other hand, normalizes this data on an annual basis, providing a more stable strategic vision.
The standard conversion formula (MRR × 12) has significant limitations. This simplistic conversion does not take into account seasonality, variable sales cycles, or non-standard contract durations. Sophisticated companies use more nuanced calculation methods that take these variations into account.
Total revenue encompasses all revenue streams under GAAP accounting principles, including subscription revenues, consulting services revenues, and one-off fees. For example, a company may post 1 million euros in Annual Recurring Revenue while generating 1.5 million euros in total revenue, the difference coming from additional services.
Why is this metric essential for SaaS models?
This measure has established itself as the benchmark indicator, as it captures the very essence of the recurring business model. In an environment where revenue predictability determines investment and development capacity, it provides management with a solid basis for strategic planning.
Investors prefer this approach, as it reveals the quality of revenues and the viability of the business model. Consistent progress demonstrates the organization’s ability to acquire new users, increase the value of existing users and maintain high retention rates.
The indicator also facilitates sector comparisons and the assessment of relative performance. Industry benchmarks, valuation multiples and performance indicators are generally expressed in terms of this metric. In 2024-2025, private valuation multiples range from 4.8x to 5.3x, according to SaaS Capital.
How do you calculate your Annual Recurring Revenue?
Effective calculation requires a rigorous methodological approach that avoids the common errors observed in around 40% of SaaS companies according to recent studies. The first step is to establish clear and consistent definitions within your organization.
Automation is a critical factor in the accuracy of your calculations. Organizations relying on Excel spreadsheets generate 70% of the errors observed during investor due diligence. Implementing specialized tools such as ChartMogul, Baremetrics or solutions integrated with your CRM significantly reduces these risks.
Cross-validation is an indispensable practice for ensuring reliability. Set up monthly checks between your different data sources: CRM, billing system, and accounting. This reconciliation enables you to quickly identify any discrepancies.
Basic formula and components
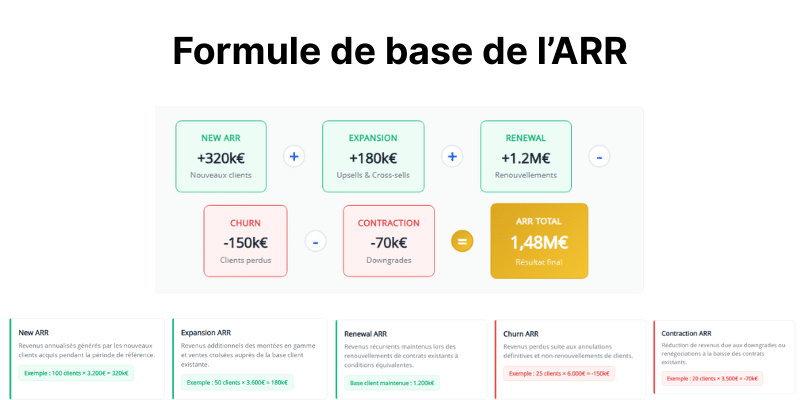
The main formula breaks down into five components that reflect the full dynamics of your user base: Annual Recurring Revenue = New + Expansion + Renewal – Churned – Contraction.
New” represents the annualized revenue generated by new users acquired during the period under consideration. For example, 100 new subscribers to a package priced at 1,200 euros per year generate 120,000 euros of New. This component directly measures the effectiveness of your acquisition efforts.
Expansion” captures the additional revenues generated by upsells and cross-sells to your existing users. If 50 subscribers upgrade from a package price of 1,200 euros to 2,400 euros per year, you generate 60,000 euros in Expansion. This component reveals your ability to increase the value of your installed base.
Annual and monthly subscriptions taken into account
Managing different types of subscription in the calculation requires differentiated approaches to maintain consistency and accuracy. Annual subscriptions are directly integrated through their contractual value, while monthly subscriptions require annualization, which must take into account the specifics of your business model.
For annual contracts, the calculation remains simple: the value of the contract divided by the number of years. A three-year contract at 150,000 euros generates 50,000 euros per year. Beware of contracts with price tiers or renewal options on different terms.
Monthly subscriptions are more complex. Simply multiplying the monthly payment by 12 can introduce significant biases, particularly in organizations prone to seasonality. A more sophisticated approach is to analyze user cohorts to identify retention patterns and adjust annualization accordingly.
Adjustments for discounts, cancellations and upgrades
Adjustments are the most technical aspect of the calculation, and frequently lead to errors during financial audits. Discounts should always be taken into account at the amount actually paid, not at the catalog price. A subscription advertised at 1,000 euros with a 25% discount should be booked at 750 euros.
Churn management requires a granular approach that distinguishes between voluntary and involuntary churn. Voluntary churn is the result of a deliberate decision by the subscriber to discontinue his or her package, while involuntary churn is usually the result of payment problems. This distinction is important because involuntary churn can often be recovered.
Subscription upgrades and reductions have a direct impact on your metrics, and must be tracked with precision. The adjustment formula is expressed as follows: Impact = (New price – Old price) × Number of subscribers × Months remaining ÷ 12.
The strategic benefits of this approach
This metric transforms the way executives conceive and execute their strategy. It provides a solid quantitative basis for assessing the impact of each sales, marketing or product initiative on long-term development. Strategic planning based on this approach makes it possible to identify the most profitable development levers and focus efforts on higher value-added activities. For example, a detailed analysis may reveal that expanding existing accounts generates a higher ROI than acquiring new users.
The metric also facilitates organizational alignment by providing a common, measurable objective for all teams. Sales, marketing, product and customer success teams can coordinate their efforts around this single metric, creating an operational synergy that accelerates development.
Financial visibility and revenue predictability
This approach revolutionizes cash management and budget planning for SaaS companies. Unlike traditional business models where revenues fluctuate, it offers a contractual revenue base that enables cash flows to be accurately anticipated.
CFOs exploit this predictability to optimize their financial structure and reduce financing costs. Documented progress over several quarters is a tangible guarantee for banks.
Predictability also enables proactive management of investments in human and technological capital. Managers can plan recruitment, product development and geographic expansion based on reliable projections.
How to optimize your ARR?
Optimization requires a global approach that simultaneously addresses the acquisition of new users, the expansion of existing accounts, and the reduction of churn. This global strategy is based on accurate behavioral data and optimized operational processes.
Strategies for increasing retention
Retention is the foundation of sustainable development, as acquiring a new user costs 5 to 25 times more than retaining an existing one. The most effective strategies are built around three pillars: operational excellence in value delivery, proactive anticipation of needs, and the creation of lasting relationships.
Personalized onboarding is the first critical link in the retention chain. The first 90 days largely determine the lifespan of a subscriber, with retention rates that can vary from 60% to 95% depending on the quality of initial support.
Salesdorado’s adviceProactivecustomer success transforms the relationship from a reactive support model to a proactive advice and optimization model. This approach requires investment in dedicated teams, generally scaled at the rate of one Customer Success Manager for every 1 to 2 million euros of annual metrics.
Upsell, cross-sell and account expansion
Account expansion is often the most profitable development lever, with marginal acquisition costs and conversion rates of up to 80% when the approach is well calibrated. Successful expansion strategies are based on a detailed understanding of the value delivered to existing users.
Successful upselling requires perfect alignment between the customer success team and the sales team, with formalized processes for qualifying and transitioning opportunities. Customer Success Qualified Leads (CSQL) are a recent innovation that help track and optimize these synergies.
Cross-selling requires in-depth knowledge of the user ecosystem and adjacent unaddressed needs. Successful SaaS companies develop coherent product suites that create natural cross-selling opportunities.
Reduce churn to protect your income
Reducing churn is a major strategic imperative, as every percentage point avoided equates to a direct improvement in progress. Benchmarks for 2024-2025 show monthly churn rates of 3-7% for SMEs and 1-3% for large organizations.
Early warning systems help combat churn by identifying at-risk users before they make the decision to leave. These systems analyze usage data, support patterns, late payments and other behavioral signals to score risk.
The recovery of involuntary churn presents significant opportunities that are often overlooked. Problems with expired bank cards, changes in bank details or temporary blockages account for a significant proportion of apparent churn. Implementing automated processes can recover 60-80% of this involuntary churn.
Tools and solutions for tracking your metrics
The choice of monitoring tools is a strategic investment that directly impacts the quality of your decisions and the speed of your development. The ecosystem of solutions has grown considerably in recent years, with specialized platforms offering advanced analytics and automated optimization functionalities.
Successful organizations typically invest 0.1-0.5% of their annual metrics in their analytics technology stack, an investment that typically generates a 300-500% ROI through improved decision accuracy.
Financial dashboards and CRM
Financial dashboards integrated into modern CRMs are transforming the way sales and finance teams collaborate to optimize metrics. HubSpot, Salesforce and Pipedrive significantly enhanced their functionality in 2024, with automatic calculations and customizable reports.
HubSpot excels particularly for SMEs with up to 10 million euros in recurring revenues, offering an intuitive interface and natively integrated functionalities. The platform automatically calculates the indicator based on recurring deal properties.
Salesforce comes out on top for large organizations with over 10 million euros, thanks to its highly customizable platform and the integration of Einstein AI for automated forecasting. This sophistication comes at the price of a high learning curve and significant implementation costs.
Essayez notre moteur de recommendation pour shortlister les 3 logiciels les plus adaptés à votre besoin
Specialized software for recurring revenue management
Specialized software brings an analytical sophistication unattainable with traditional CRM. ChartMogul, already mentioned, maintains its leadership position with advanced analytics, sophisticated segmentation and integrated industry benchmarks.
Baremetrics stands out for its all-in-one approach, combining analytics and automated revenue recovery. The integrated Recover solution automatically recovers a portion of involuntary churn, while Cancellation Insights help to understand the reasons for voluntary churn.
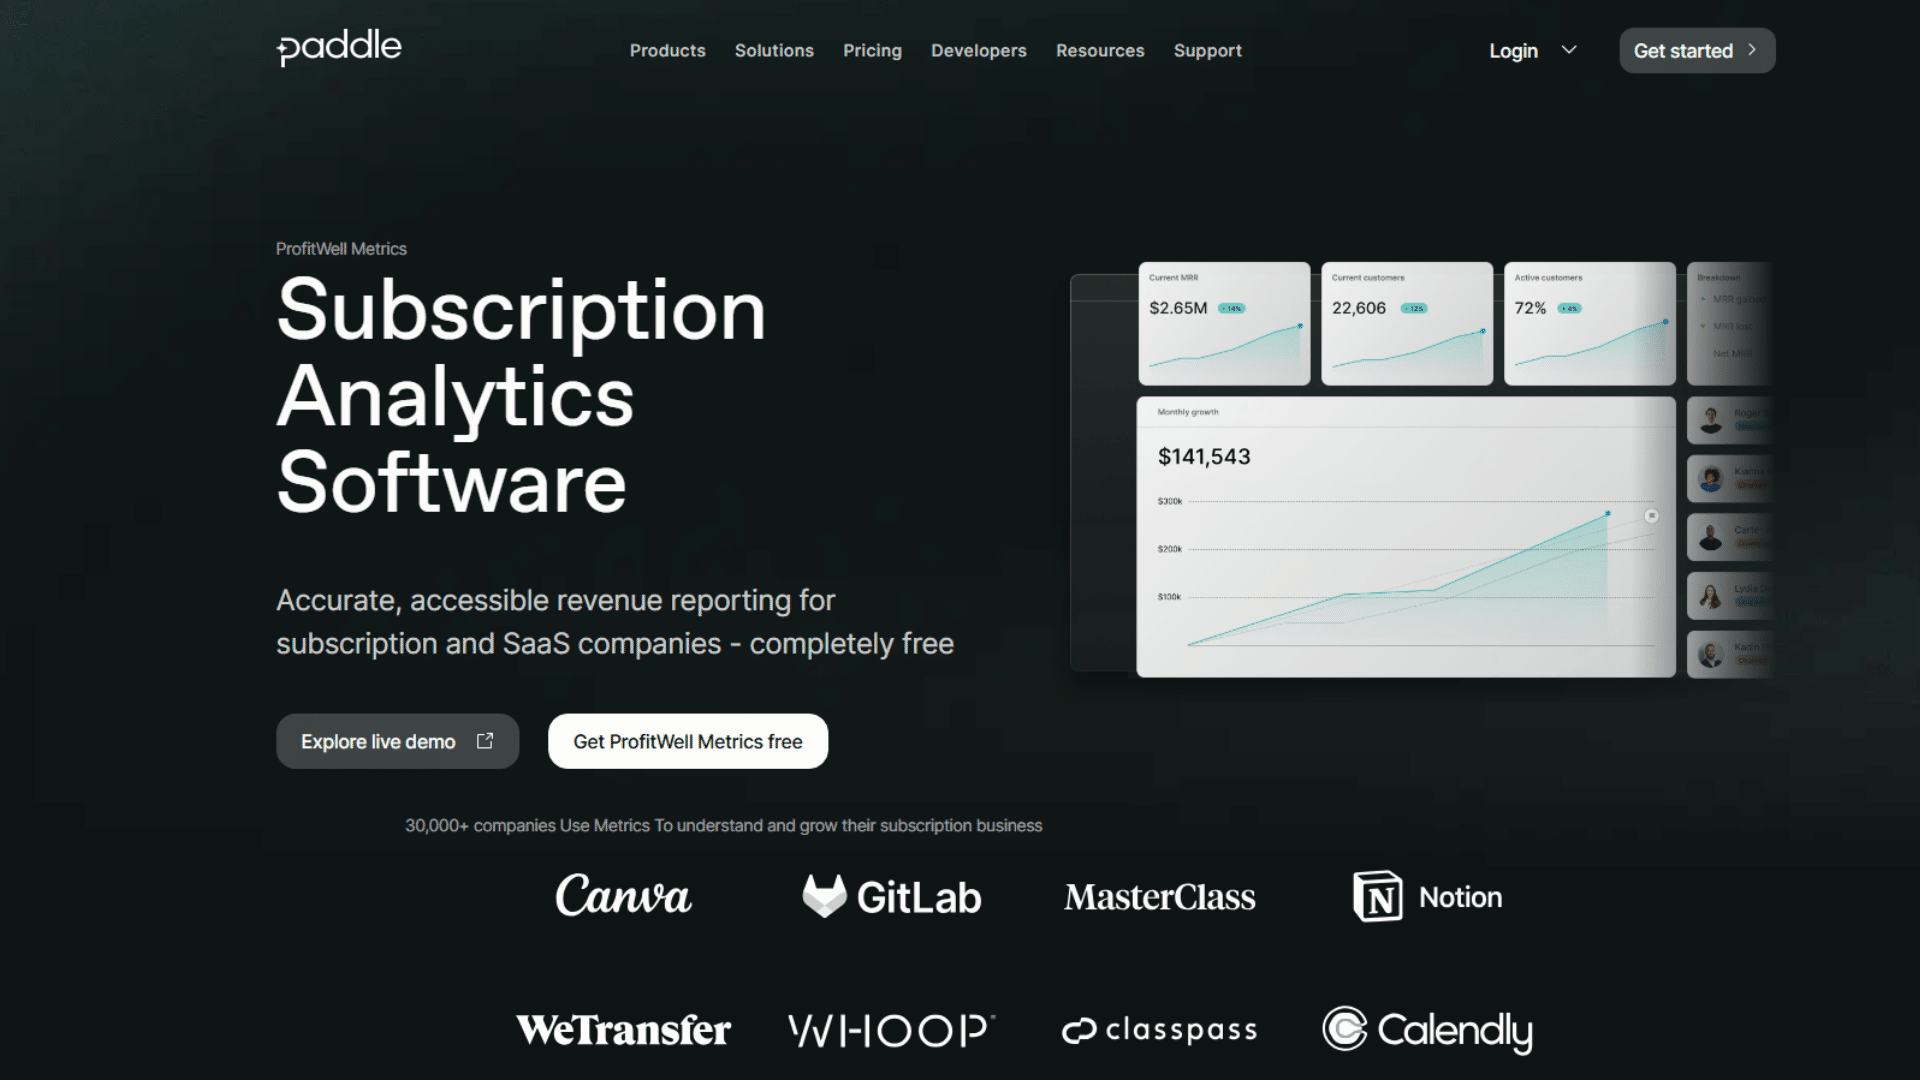
ProfitWell is revolutionizing the market by offering its metrics platform free of charge, a strategy that has enabled it to capture significant market share. Advanced features such as Retain® for churn reduction are offered as paid modules.
Additional indicators to monitor (MRR, LTV, CAC)
This notion cannot be analyzed in isolation, and must be complemented by a set of indicators that shed light on different facets of business performance. Generally, it is associated with :
- Monthly Recurring Revenue provides the operational granularity to quickly identify trends and adjust tactics on a monthly basis.
- Customer Acquisition Cost (CAC) and Lifetime Value (LTV ) are the essential duo for assessing the unit profitability of your acquisition model. The LTV/CAC ratio must exceed 3:1 to guarantee economic viability, with an ideal of 5:1 for large organizations.
- Net Revenue Retention (NRR) measures your organization’s ability to maintain and grow revenues from your existing base. An NRR above 110% indicates solid organic development, while an NRR of 120% or more characterizes exceptional SaaS companies.
Does ARR apply only to SaaS?
This metric transcends the traditional SaaS sector, and is suitable for all business models based on recurring contractual revenues. Media companies with digital subscriptions, telecom services and e-learning platforms can all make effective use of this metric.
Adapting to non-SaaS sectors sometimes requires methodological adjustments to take account of sector-specific features. Media companies have to deal with advertising seasonality, telecom operators often integrate equipment revenues, and educational platforms manage specific school cycles.
The relevance also extends to hybrid models that combine recurring and transactional revenues. Marketplaces with vendor subscription fees, fintechs with mixed revenues, or e-commerce companies with subscription programs can use this approach to specifically track their recurring component.
How do you present your Annual Recurring Revenue to investors?
Presentation to investors requires a structured approach combining methodological transparency, analysis of development dynamics, and realistic forecasting based on solid historical data. The waterfall format is the absolute reference, breaking down development into its various components.
The quality of the indicator counts as much as its magnitude in the eyes of sophisticated investors. Systematically present your Net Revenue Retention, your churn rates by segment, and the evolution of your cohorts to demonstrate the solidity of your recurring base. Investors place a significant premium on organizations with an NRR above 110%.
Linking this metric to unit economics completes the presentation, demonstrating the profitability and scalability of the model. Present your LTV/CAC ratios, your payback periods, and the evolution of your acquisition costs per channel to reassure you of the economic viability of your model.
Documenting your calculation methodology and reconciling it with your accounting revenues eliminates technical queries and speeds up the due diligence process. Prepare a detailed memo explaining your definitions, adjustments and projection assumptions. This technical transparency boosts investor confidence and optimizes the financing terms negotiated.