Good reporting tools should do two things:
- Track useful KPIs and information regularly and easily
- Analyze certain aspects of your performance in greater depth to identify areas for optimization
Depending on your stage of development and the complexity of your business operations, the reporting of certain CRMs is sufficient, but sometimes you will need to equip your teams with business reporting tools, or even with even more complete business intelligence tools.
In this article, we present 11 of our favorite tools.
Sommaire
#1 Table
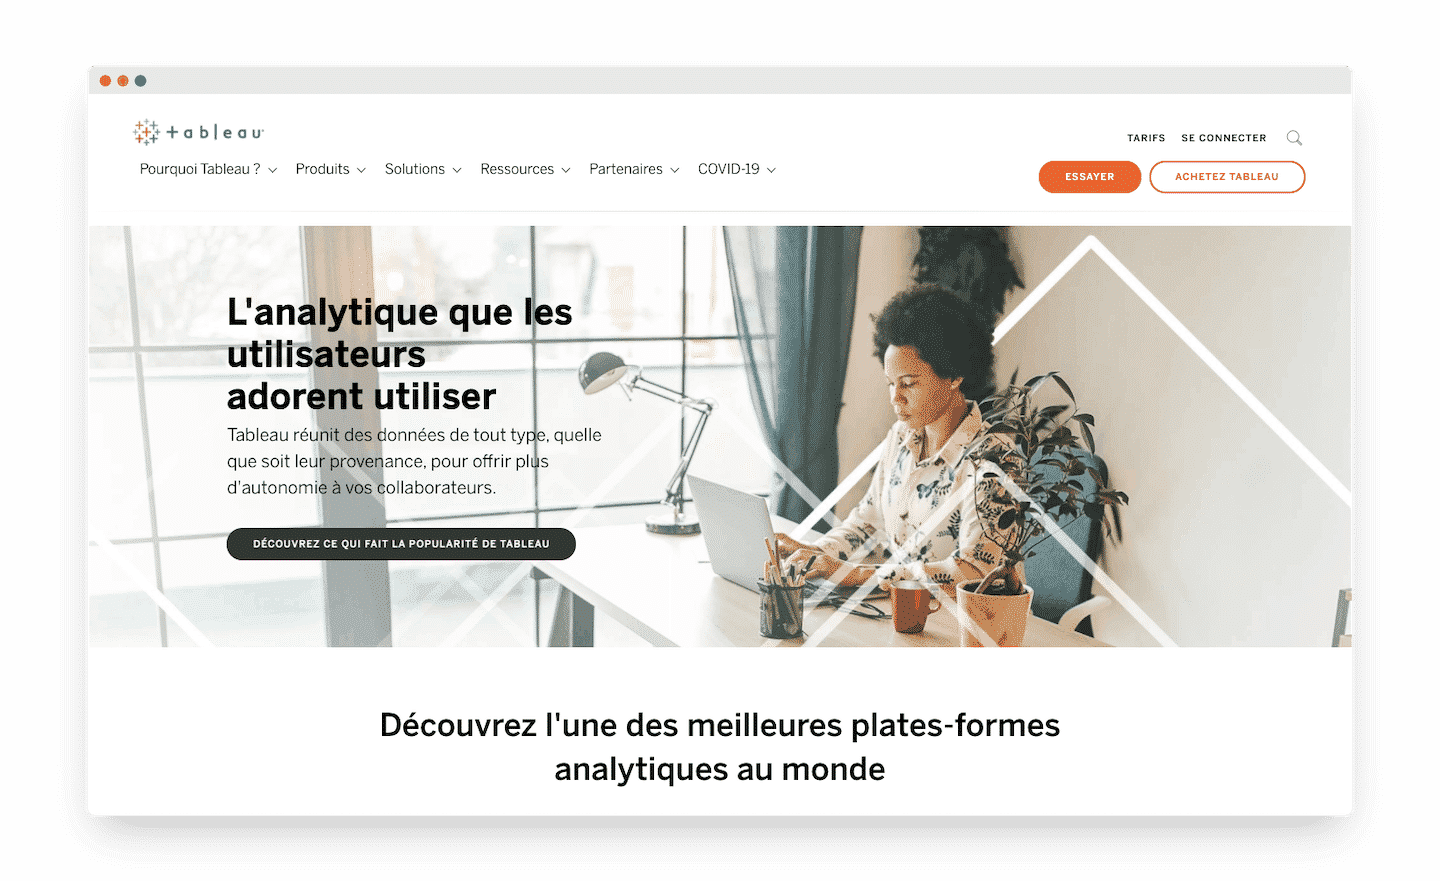
Tableau is one of the most mature BI tools on the market, with robust data visualization and analysis capabilities. Tableau has excellent visualizations that make data exploration accessible. It is an ideal BI tool for medium and large enterprises.
Special mention for Tableau’sdrag-and-drop interface that allows users to create dashboards and in-depth analysis with ease.
We also appreciate the ability to set up alerts and subscriptions for reports to be shared within the organization.
Tableau offers cloud or on-premises access, and access via software. Three licenses are available, depending on your needs:
-
- Viewer : to view dashboards and visualizations, and interact in a secure platform ($12 or $15 per person per month)
- Explore: to explore data and access self-service analytics ($35 or $42 per person per month)
- Creator : same features as the previous licenses, with the addition of the creation of a workbook with a new data source, the ability to connect to raw data without being limited to existing published data sources ($70 per person per month)
#2 Looker
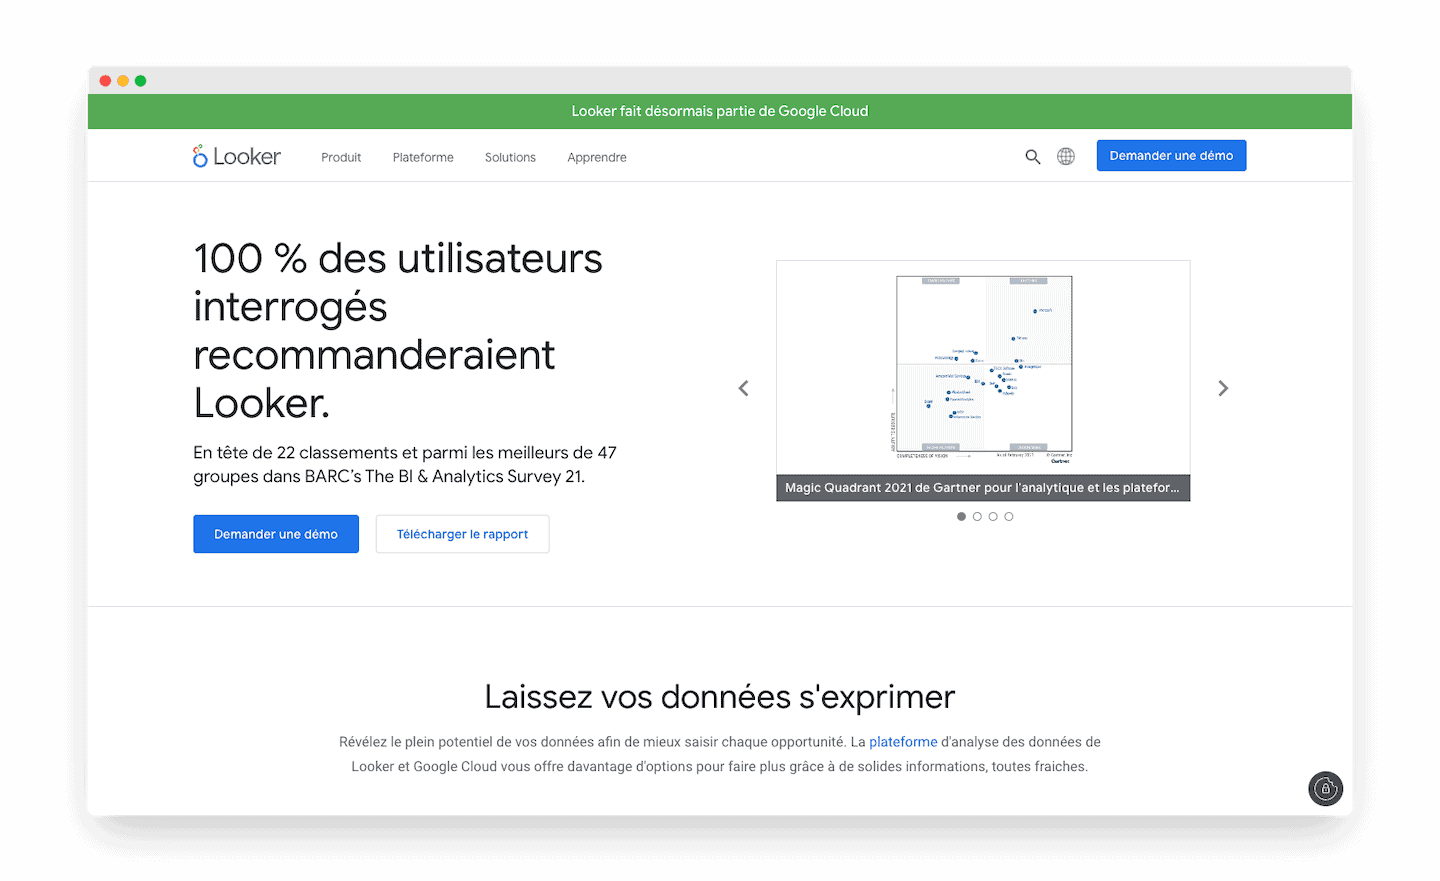
Looker is a business-user-focused tool, meaning that it is designed for non-technical users.
The advantage is that after the configuration, there is almost no need to make adjustments. These tools allow company members to build their own analyses without having to write SQL.
Looker allows you to access, explore and operationalize data using its library of visualizations, or to create your own.
Once Looker is configured, it is easy for business users to explore the data without much training. Analysts will appreciate the way LookML facilitates version control and debugging.
Looker pricing is tailored to your needs, taking into account specific factors such as the number of users and the size of your deployment.
#3 Chart.io

Like Looker, Chartio is a business-user-focused tool. Once configured, you will be able to take advantage of the powerful and intuitive user interface that enables data discovery across the organization.
Good point for the easy sharing of information: just share the URL of the page you are working on with other registered users, or upload your documents directly in the format of your choice. We also appreciate Chartio’s top-notch customer support, which works directly with users to understand their data.
A subscription to Chartio includes unlimited data connections, reports and dashboards. Subscriptions are tiered according to license usage and include full support.
- The Startup offer is 480$/user/year
- and the Growth offer at $720/user/year.
- For the Premium offer, contact Chartio for pricing information.
Finally, you can benefit from a free trial period.
#4 Salesforce
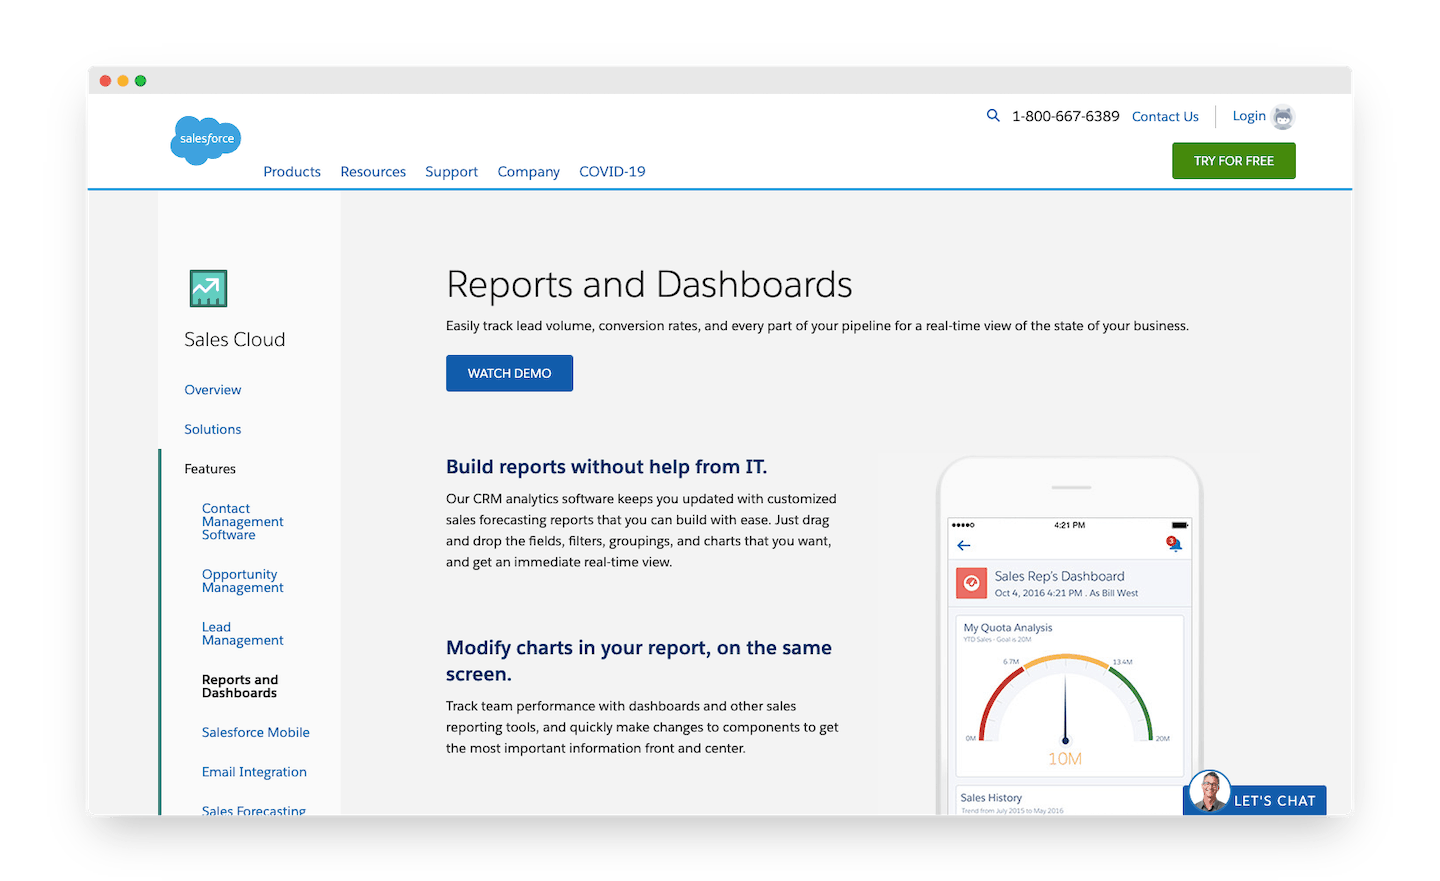
Salesforce CRM ‘s Reports and Dashboards feature makes it easy to track lead volume, conversion rates, and every part of your pipeline to get a real-time view of the state of your business. CRM analysis software allows you to quickly create customized sales forecast reports. Simply drag and drop the fields, filters, groupings and charts you want.
The Dashboards feature is also a great way to stay organized and proactive. It allows :
- review indicators
- search for the data most important to your success
- study examples of dashboards
- create your own customized dashboard
To access this feature, you will need a Salesforce plan. The Professional plan (€75 per user per month with an annual subscription) which has no user limit may be an option if you want to use Salesforce for customizable dashboards.
#5 Hubspot Reporting
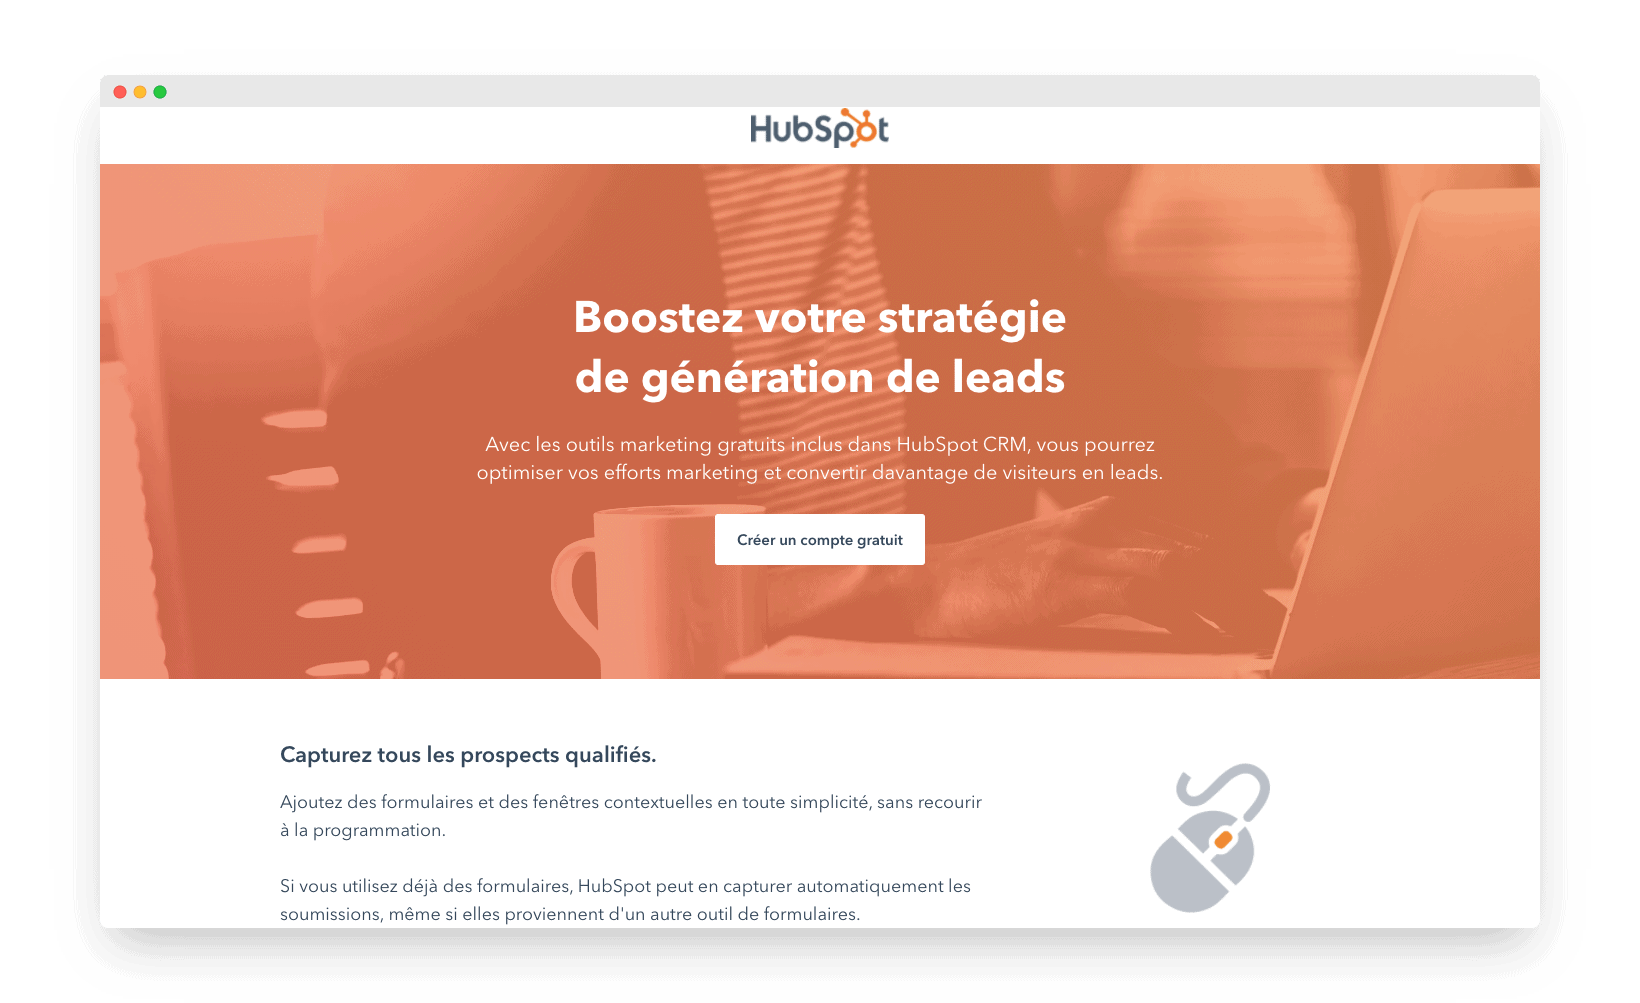
The HubSpot CRM reporting add-on allows users to drill down into marketing, sales and service data. It allows users to create custom reports and dashboards from scratch or analyze over 150 pre-built reports.
For companies that use HubSpot’s marketing, sales and service centers to manage their business, no integration is required to access all the data you need. If you use external platforms, HubSpot can also report on data from integrated applications.
To access Hubspot’s marketing function, you need to go through the pro package, at €740/month. It allows you to create customized reports:
- Website traffic analytics
- Calculated properties
- Campaign Report
- Customized reports
#6 InsightSquared
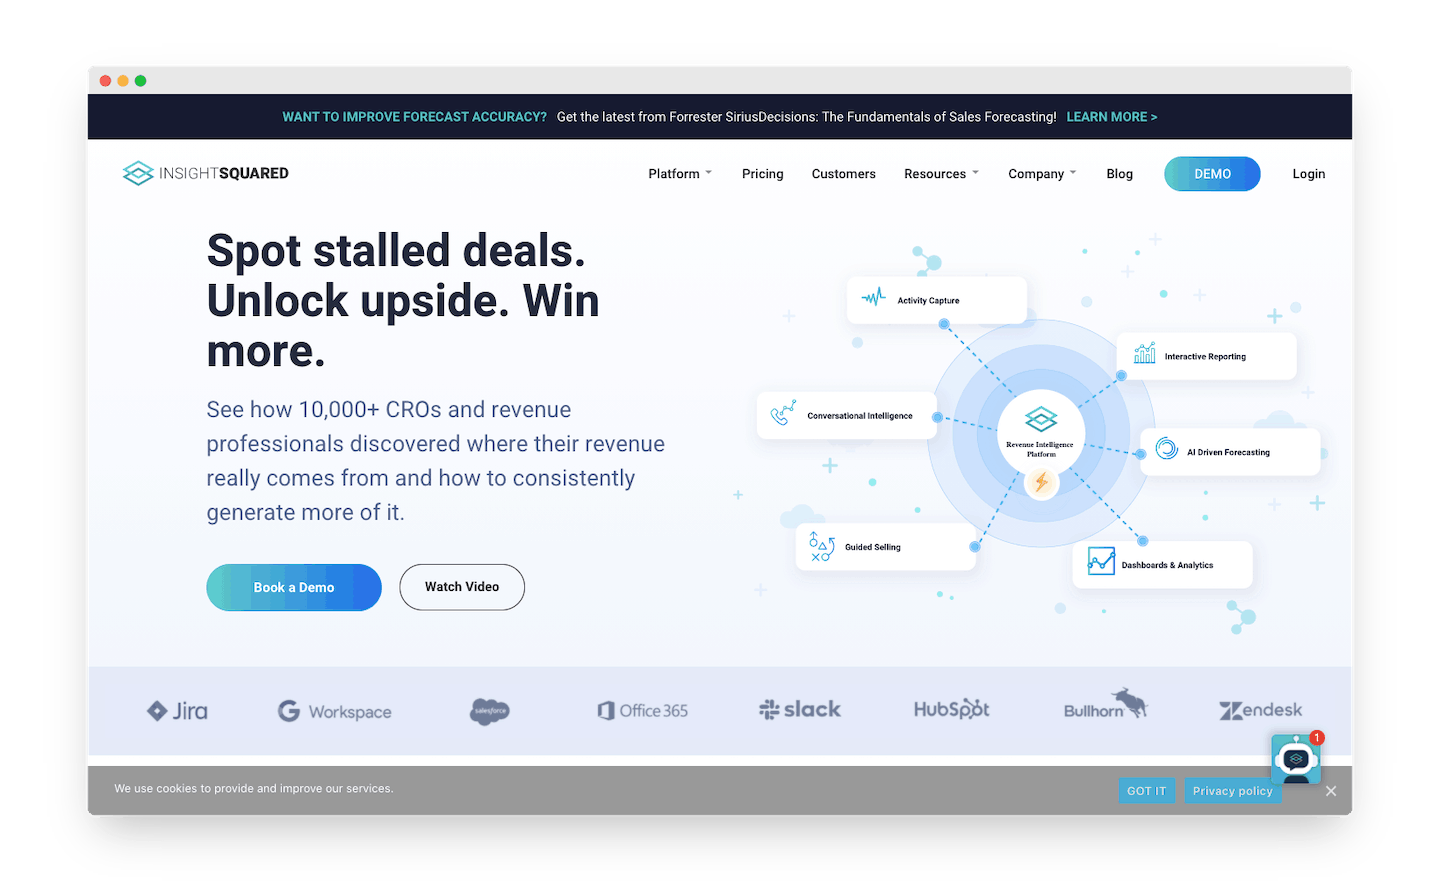
InsightSquared is a solution for sales analysis. It helps companies manage their pipelines, improve conversion rates, make accurate forecasts and identify areas for coaching. The platform extracts data in real time and creates data visualizations useful to Sales Operations.
The platform is designed to improve the results of your sales force. We particularly appreciate the fluidity of the interface and its ease of use. The visuals are neat and it is possible to customize all the details of the display.
Rates are to be defined directly with InsightSquared.
#7 Microsoft Power BI
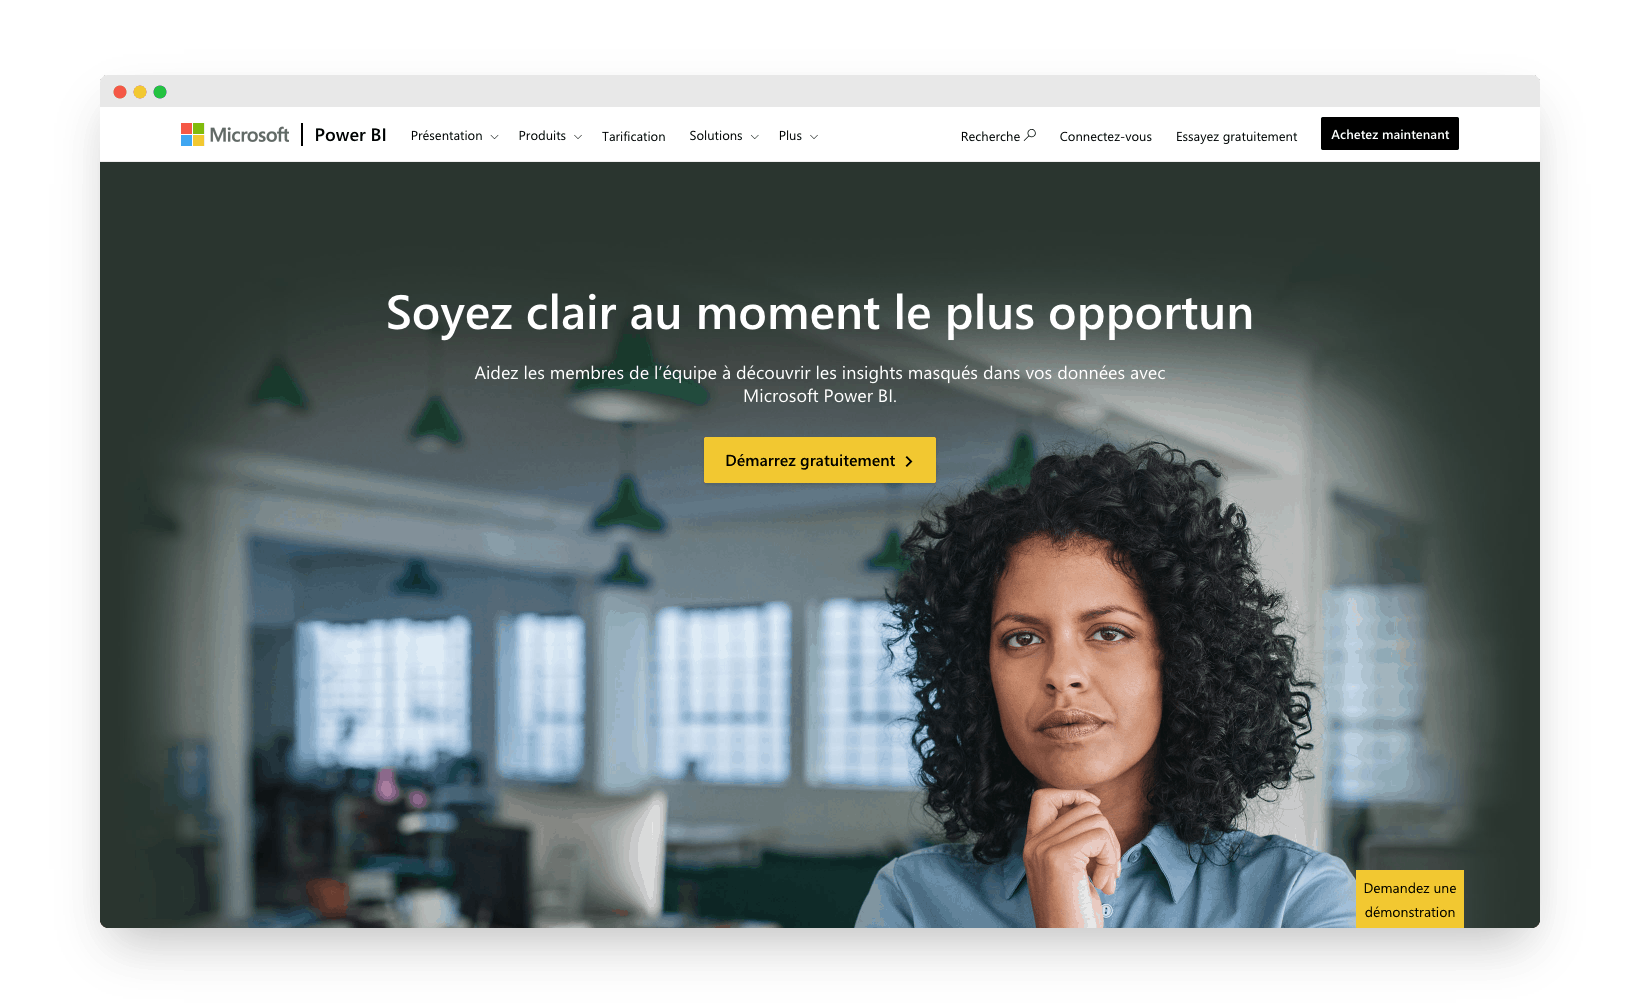
Microsoft Power BI is a business intelligence and reporting software to ingest, process, model and report data. It is really a BI tool, specialized in data management. The software serves as a unified platform for self-service and enterprise analysis and reporting. Thanks to advanced AI, access to analytical information is very fast.
Its strengths?
- Multilingual support (DAX, Power Query, SQL, R and Python)
- Extensive data integration capabilities: +120 free native data source connectors.
- Interactive dashboard visualization, which makes data storytelling highly readable and access to pre-built/personalized visuals
Microsoft Power BI offers a free plan to create and edit custom reports for all levels of expertise. Alternatively, the Power BI Pro plan at $9.99 per user per month additionally allows for collaboration in personal and team workspaces and offers 10GB of storage.
Finally, the $4,995 annual Power BI Premium subscription provides cloud storage and access to dedicated computing resources.
#8 Sisense
Sisense for Cloud Data Teams (formerly Periscope) is an “analyst-focused” tool: that is, composed of “code-first” data mining layers. Creating and customizing reports therefore requires code in SQL, Python and R to allow analysts to visualize complex data models.
Sisense enables business users to explore and learn from data by providing information in plain language. Business users can use templates to create easy-to-understand dashboards using templates.
Key features of Sisence:
- Run, save, and share analyses on billions of rows of data in seconds.
- Explore data and perform basic calculations and aggregations.
- Create rich visualizations and share dashboards using a drag-and-drop interface.
- Set up automatic logic-based alerts to track anomalies in the data.
The advantage of Sisense is that the tool combines hosting, data connectors and visualization layers in a single solution. This makes it the ideal solution for teams that do not have many resources. The tool’s data caching allows for fast queries.
Rates are available on request. Count a little less than a hundred euros per license.
#9 Mode
Like Sisense, Mode is an “analyst-focused” tool, easy to set up and use. It is accessible online, which facilitates collaboration, and allows for queries in SQL, Python and R. The three main features of Mode are:
- Query data using SQL, Python and R
- Visualize data with interactive dashboards and share it across the enterprise
- Integrate custom and interactive analytics into your application using white label elements
The most of Mode? Thanks to its HTML editor, Mode offers a customizable environment and the possibility of integrating white label analysis dashboards on your site.
Mode offers three formulas:
- The Studio package is free and allows five users at a time.
- The Business offering includes more features (API, email & Slack sharing, support), tailored for data teams.
- Finally, for large enterprises, the Enterprise package provides tens of millions of rows, access to premium support and API access at the administrator level.
#10 Grow
Grow BI software is a powerful analysis and reporting tool that provides simple dashboards for business data information. Grow allows you to :
- Handle your data, making it easy to prepare, cleanse and transform data
- Connect your data: native integrations connect to platforms, databases and CRM to seamlessly import your data. Your measurements are therefore up to date and reliable.
- Once your data is imported, it is easy to prepare, clean and transform. Grow supports PostgreSQL transformations and No Code transformations that write SQL in the background.
- Store your data.
- Easily marry and transform disparate data sources, filter, slice and dice, and explore different visualizations as you navigate your data to create metrics in minutes.
We particularly appreciate the design of Grow’s interfaces, very pleasant. In addition, Grow offers quality content, explaining how to make great dashboards and showing examples to draw inspiration from.
The price depends on your structure and your needs. You can benefit from a free trial period.
#11 Google Big Query
BigQuery is an enterprise data warehouse, which enables ultra-fast SQL queries using the processing power of Google’s infrastructure.
That said, Google BigQuery is more for marketing functions than sales, hence the larger data volumes. For marketers, BigQuery allows you to:
- Store marketing data
- Combine data from multiple sources
- Access all your historical data
- Automate data refresh
- Perform ad hoc data analysis
Google BigQuery pricing is based on usage. It is therefore variable, depending on the volume of data stored, the amount of data transferred to BigQuery and the volume of information churned up by the queries.