Data quality has become an essential lever for the development of a company’s activity, even if the latest digital developments do not overlap with its core business. A study conducted by IBM puts forward the following figure: inadequate data management cost the American economy more than 3,000 billion dollars in 2016!
This staggering estimate clearly shows the gains to be made from effective, comprehensive and ongoing management of your data quality. Different tools are available on the market to meet these different processing, updating and cleaning needs. Regardless of the type of solution chosen, the most important thing is to know the good practice in data quality and to be able to conduct a regular performance audit of the management of this data.
SAS is a complete data management software that allows the creation and management of databases, the analytical processing of databases and the creation and distribution of summary and listing reports. Large companies use it such as Honda, Bank of America or the NGO WWF.
Strengths :
- Comprehensive tools for large companies
- Suitable for all sectors of activity
Price :
- From €7,000/year for basic functionality to several hundred thousand €/year
2. Informatica
Informatica offers several solutions for data integration, analysis, and quality improvement. The company also offers data storage services in the cloud. It also offers a SaaS solution.
Strengths :
- Can be integrated with many data sources
- Ease of use and maintainability.
Price :
- Depending on the number of features.
3. Melissa
Melissa is a tool dedicated to data verification (identity, address, phone, email) which is essential to keep data quality high. They also offer services around location and demographic data.
Strengths :
- Can be combined with other internal tools (emailing solution, CRM…)
- Has SaaS solutions available
Price :
- On request
4. Oceanos
Oceanos designs data management strategies that optimise sales and marketing performance. The tool can be integrated with a CRM file and allows to score the quality level of the data and to clean, update, enrich and analyse the data.
Strengths :
- Numerous possible integrations (API, Zapier, Salesforce…)
Price :
- 1500 to 9500 per month
Sommaire
2. Data Preparation
Data preparation includes all the steps involved in cleaning up data to ensure its consistency and quality. Preparation includes, for example, merging several data sources, filtering unnecessary data, consolidating, aggregating data and calculating additional values based on the raw data. Preparation is important because inconsistent and poor quality data can distort the resulting information. It can also make analysis and data mining slow and unreliable. By preparing the data in advance, companies are better able to exploit its full potential.
5. Google Dataprep
Cloud Dataprep is an intelligent visual service for exploring, cleaning and preparing data for analysis that works without a server. You can import multiple files, merge them, clean, enrich, standardize…
Strengths :
- Easy to use
Price :
- On average 3€ per hour of use
6. Talend Data Preparation
Talend Data Preparation is a data preparation solution with 3 different packages: a free and open source software, a paid download and a paid cloud solution.
Strengths :
- A solution is possible for every type of need
Price :
- On request
7. Dataiku
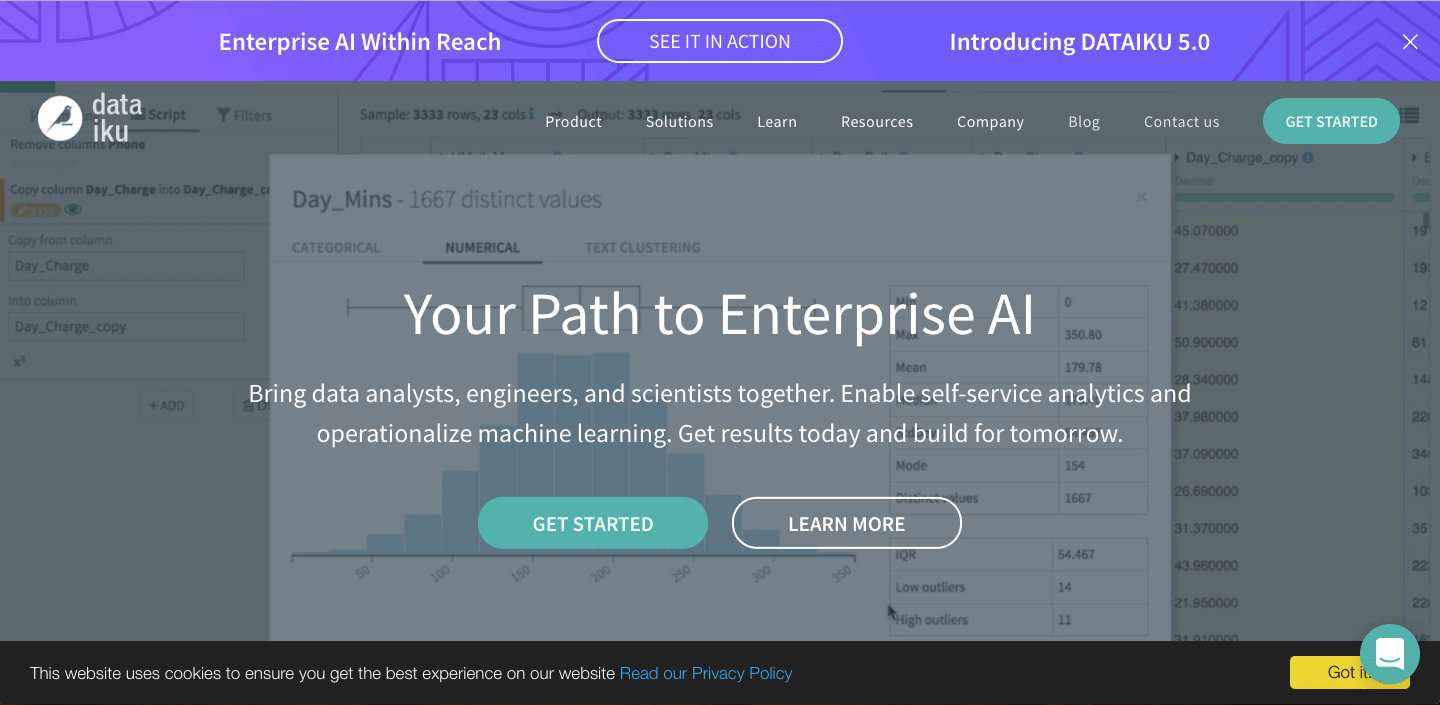
Dataiku is a data analysis tool, usable by both engineers and marketers, powerful for data preparation. The interface is simple and interactive so that it is easy to use for marketers, and advanced and technical enough to appeal to data engineers.
Strengths :
- Simple and intuitive interface for both engineers and marketers
Price :
- A free basic version
- On request for a more complete version
8. Qlik Sense
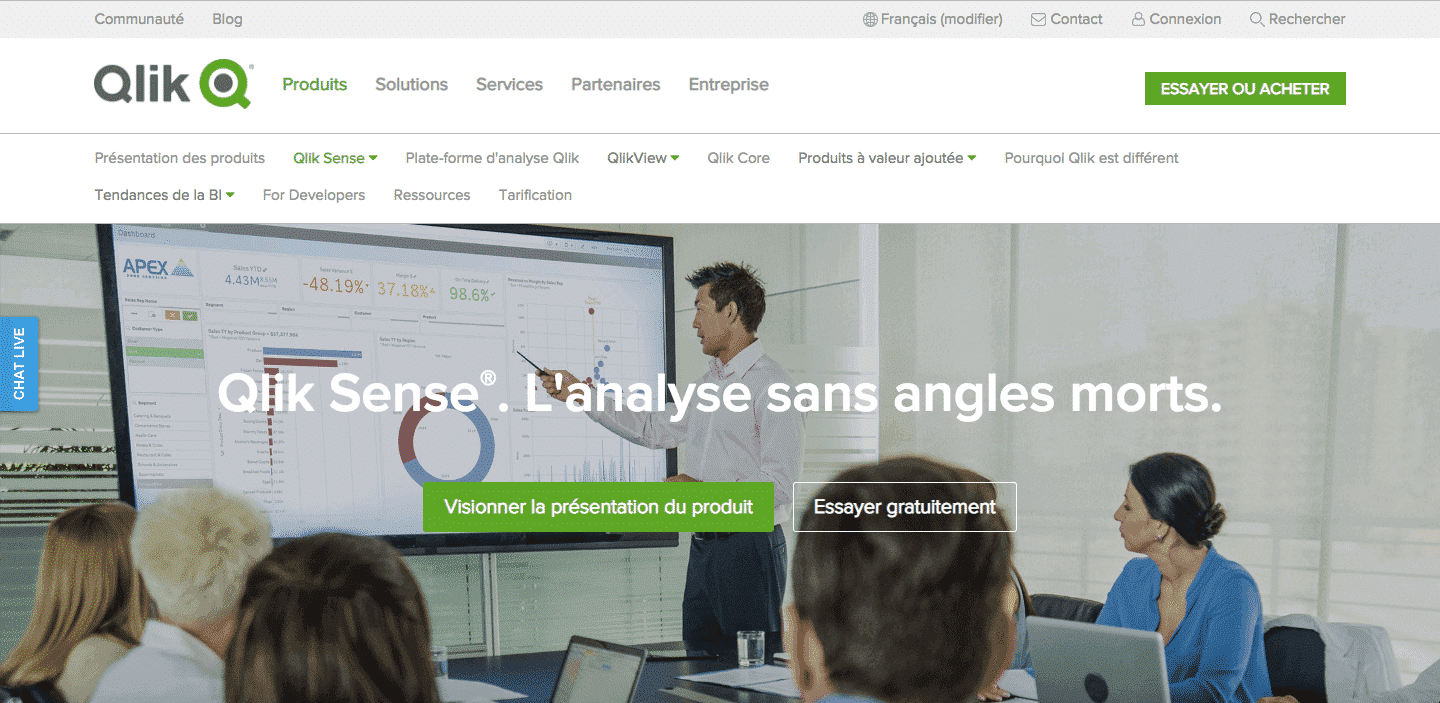
Qlik sense is a tool that is particularly suitable for the uninitiated. The interface is very visual, and analysis is facilitated by automatic suggestions. Its playfulness makes the information accessible to all the company’s professions. You can watch a 60 second demo by watching this video.
Strengths :
- Can be used by all the company’s businesses
- Simple and fun interface
Price :
- A free basic version
- Tailor-made for more functionality
9. Octolis
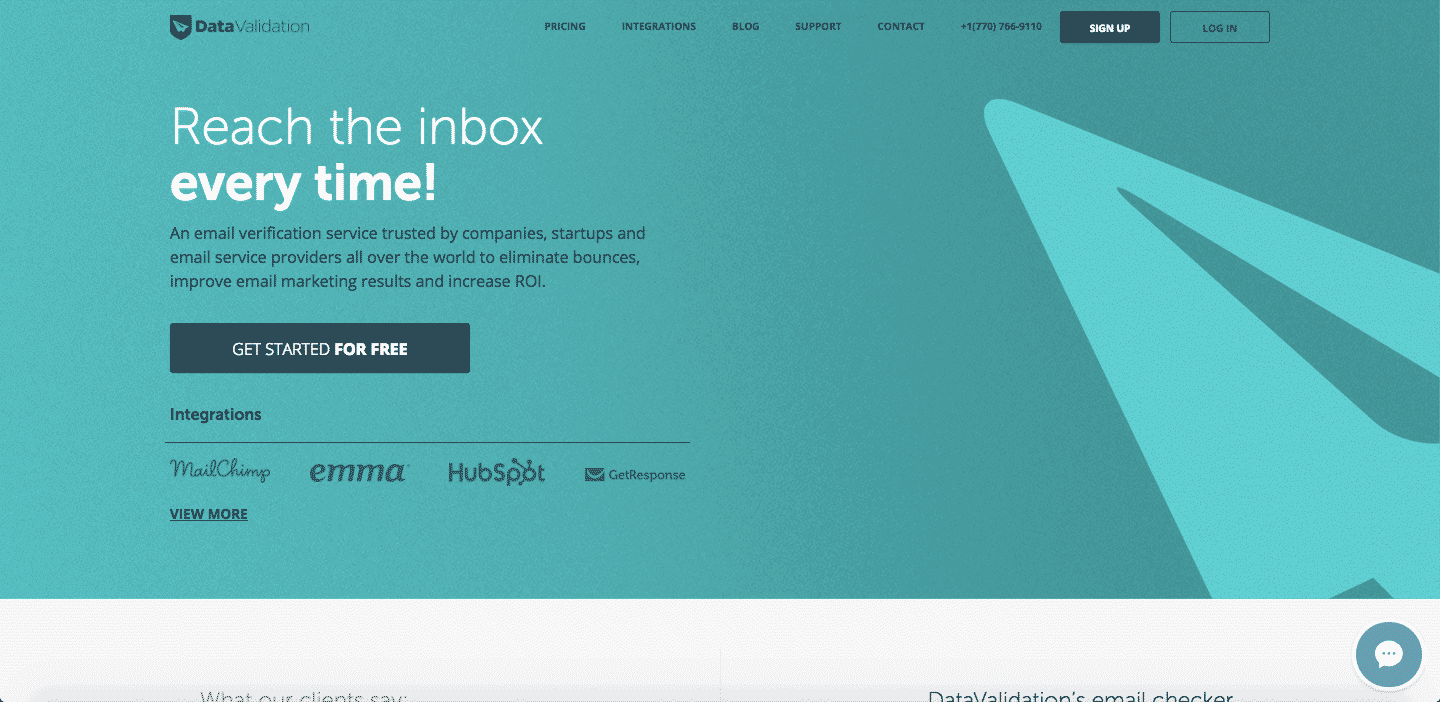
DataValidation is one of the most powerful email cleaning solutions on the market. It will allow you to identify invalid email addresses so that you are not considered as a spammer during your emailing campaigns.
Strengths :
- Easy to use
- Accuracy of results
Price :
- 70 for 10,000 verified emails, $300 for 100,000 emails
12. 76310

The 76310 solution is specialised in the control and correction of postal addresses and complies with the RNVP standard for the computer processing of postal addresses and is approved by La Poste SNA (national address service).
Strengths :
- Interface available for RNVP processing
- RNVP processing, moving and deduplication software
- SNA approved
Price :
- For 10,000 addresses (use in SaaS mode) – €200
- For 100,000 addresses (use in SaaS mode) – €400
- Provision of on premise software – from 16,000 € HT / year to 30,000 € HT / year
13. Egon
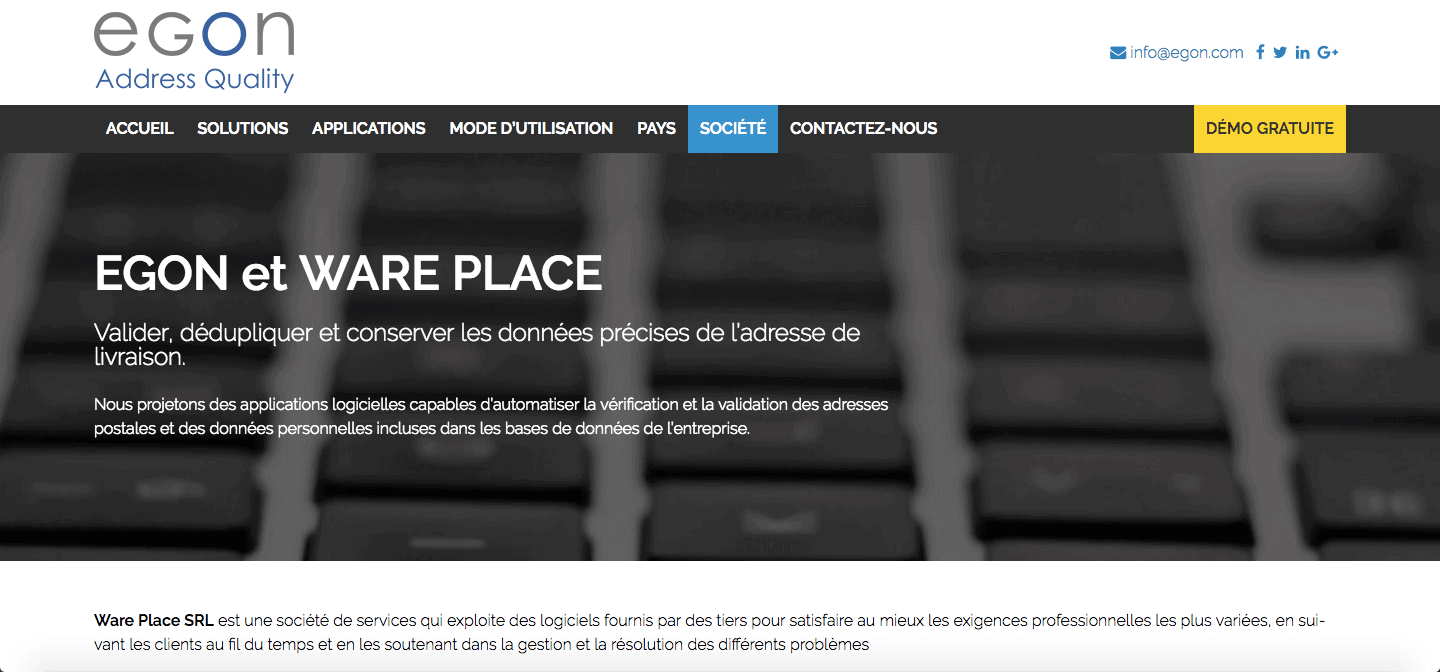
Egon is one of the leading software packages on the international market for the standardisation of various personal data (name, date of birth, titles, telephone numbers, email, tax code, VAT number, bank details, postal data, postcode, foreign names, identity documents)
Strengths :
- Large selection of data to be standardised
- Complete data validation solution
Price :
- On request
Data quality audit
If data is the fuel of your business, especially of your marketing & sales departments, then that data has to be of good quality. Working with poor quality data generates all kinds of costs and can contribute to poor strategic decisions.
How to set up a data quality management system? What criteria should be used to qualify data quality? What are the examples of data quality metrics that are easy to implement? What are the main causes of data quality problems?
We will deal with each of these issues one by one. We hope that this guide will help you in building or improving your organisation’s data quality audit process.
Failure to audit can have detrimental consequences for your business
The consequences of poor data quality control
Poor control of the quality of your data can have very detrimental consequences on your organisation, at all levels: the cost of your marketing campaigns and their performance, the understanding of your customers’ needs and expectations, the efficiency of your sales processes (lead-to-customer processes), the relevance of your strategic decisions, etc. RingLead has published a very interesting infographic on this subject. The software company shows the costs associated with poor quality data. Here is a small extract from the infographic:
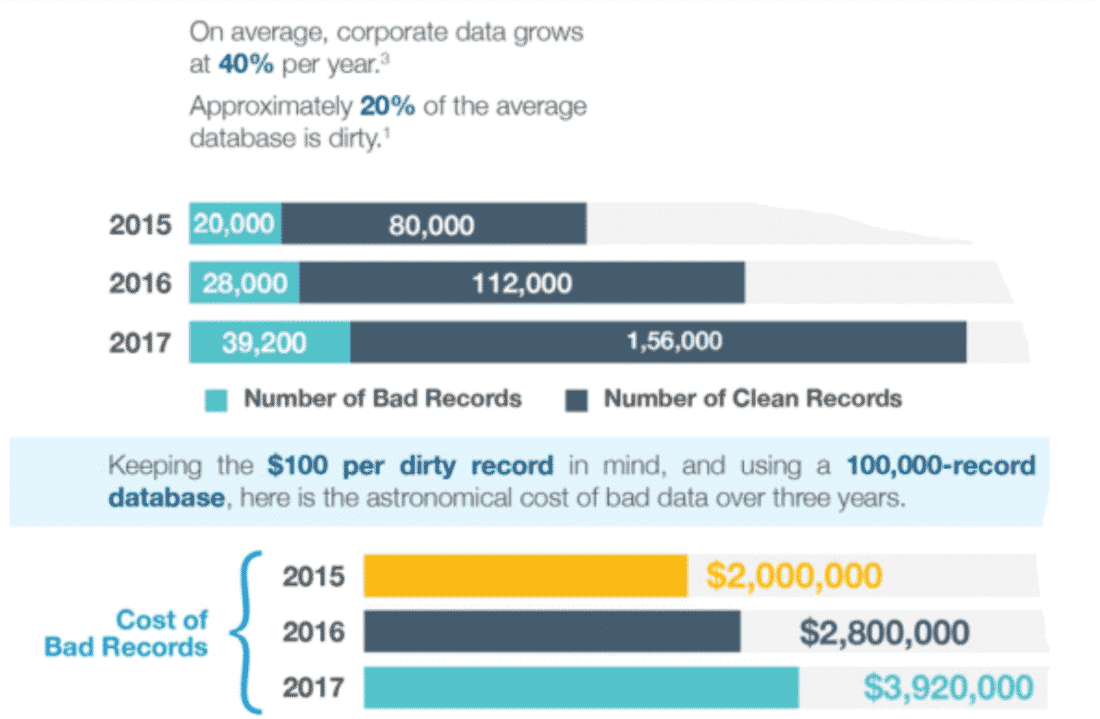
RingLead first points out the staggering growth in the volume of data available to companies. Every year, the volume of data increases by 40%. But 20% of the data is bad data. We will come back later to the criteria for qualifying the quality of data. The costs of using poor quality data are increasing year on year. Another study, by the well-known firm Gartner, tells us that the lack of data quality control costs the companies surveyed an average of 14 million dollars per year!
The intangible costs of poor data quality control
Not controlling the quality of your data is very expensive from a material and financial point of view. This is obvious. But alongside these “tangible” costs, we must also take into account all the intangible costs, which are difficult by definition to measure but quite easy to imagine.
Let’s say your company is looking to spread a data-driven culture. You make every effort and develop a pilot programme to demonstrate the ROI benefits of data-driven decision making based on business intelligence and analytics. But the problem is that if your data is not of good quality, you will find it very difficult to demonstrate the benefits of business intelligence to your employees and superiors. If you question the quality of the data used after the fact, it’s too late, it will sound like an excuse. You are better off addressing the data quality issues and demonstrating up front the critical importance of having high quality data to generate ROI from the data.
The main intangible cost: poor decision making
Perhaps you are not concerned with this example. Maybe you don’t need to demonstrate to others the importance of integrating data analysis into the decision-making process. Maybe your company is already doing analytics, but not paying much attention to data quality control. Well, in that case, you and your organisation may be faced with an even bigger problem: making decisions based on incorrect data. In a sense, it is better not to be data-driven at all and use your intuition than to be data-driven without controlling the quality of the data used. In the latter case, the impact of poor decisions made can be catastrophic. For example, let’s say your data is incorrect and shows that your cash flow is in the green. You are encouraged to develop new actions and increase your investments. Except that after a few months, you finally realise that you have serious cash flow problems. Except that it is a little late, you are unable to pay your suppliers or even your employees. Checking the quality of your data can help you avoid these problems.
A virtuous cycle to guarantee the quality of your data
Data quality management and control is a continuous process that can be illustrated as a cycle:
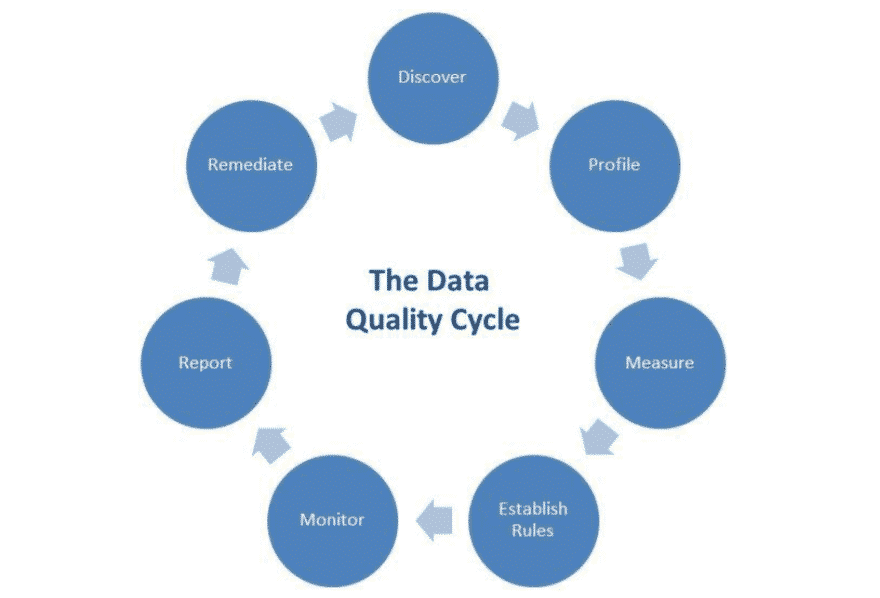
Here are the different steps summarised in a few words:
- Data discovery => Methods that facilitate the interpretation of raw data by non-technical users (marketers, etc.). Data Visualisation is an integral part of this stage.
- Data Profiling => Process of analysing data in detail, comparing data with their meta-data, calculating statistics and evaluating data quality and its evolution.
- Data Quality Rules => Depending on business needs, the process of defining the rules that data must follow to qualify as good quality data.
- Monitoring => The process of continuously monitoring data quality on the basis of the quality rules defined upstream. This includes, for example, the implementation of notification systems that allow you to be alerted when a data item falls below the quality threshold.
- Reporting => The activity of creating dashboards and implementing KPIs to monitor the evolution of data quality over time.
- Remediation => The process of correcting errors and problems as reported in the dashboards.
This cycle alone would deserve a long development. Here we will focus on 5 dimensions of data quality that you should take into account in your audit process.
5 key dimensions for setting up your audit system
To measure the quality of your data, you obviously need quality criteria. You need to clearly define them in advance. These dimensions cut across different aspects of quality. There are 5 main dimensions that qualify data quality: accuracy, consistency, completeness, integrity and timeliness.
Accuracy
The first criterion is the most obvious: does your data reflect reality? Are they correct, valid? Do they accurately describe what they claim to represent? Changes in user/customer status or transactions contribute to the continuous evolution of the data and should be integrated into your data set in real time. The accuracy of the data can be measured from documentary sources (e.g. your order management software) or through confirmation techniques. The aim is to assess whether or not your data contains errors.
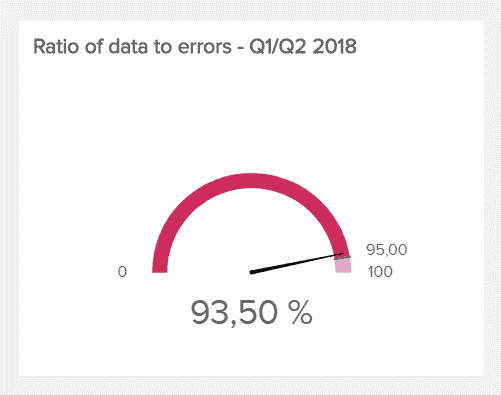
A commonly used metric for measuring data accuracy is the data accuracy ratio, i.e. the percentage of correct data. The higher this ratio, the better, obviously. There is no average or target ratio. It all depends on your company, its size, the volume and type of data processed. In most cases, a ratio above 85% is considered very good.
Coherence
Strictly speaking, the consistency dimension makes it possible to specify whether two data located in two different databases conflict with each other or not. It is a question of knowing whether the data dispersed in your different databases are consistent with each other, if for example the information of the same individual recorded in several databases is the same. However, more broadly, consistency does not necessarily imply accuracy. Take the example of setting up a rule that would automatically check whether the sum of employees in each department does not exceed the total number of employees in the organisation.
Completeness
Do you have all the data you need to draw the right conclusions? Are all your fields and attributes filled in correctly? Are there any empty fields? Do you have any missing data? These are the things that this criterion is designed to measure. The lack of completeness of data can distort the results of your analyses. This dimension is therefore essential to take into account. An example of data quality metrics you can use to assess this criterion is the number of empty fields in a given data set.
Integrity
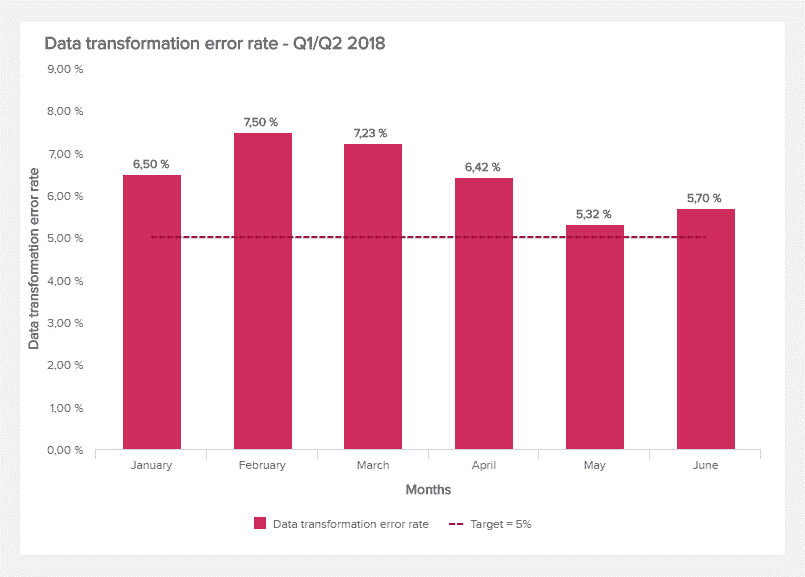
Also known as data validation, integrity refers to the tests and procedures designed to get rid of any errors and anomalies found. It involves ensuring that data is legible and correctly formatted (for example, that all dates are in DD/MM/YYYY format). The data transformation error rate can be used to measure the proportion of errors that occur in data transformation operations (conversion from one format to another). This ratio can be monitored over time.
Topicality (or freshness)
This last dimension is about ensuring that data is available and accessible at all times. This criterion measures the time between when the data is requested and when it is actually available for use. Data time-to-value can be used to measure this dimension. The objective is to reduce this time as much as possible, aiming for an ideal of immediacy.
No matter how you improve the quality of your data, you will always need to measure the effectiveness of your efforts. These examples of data quality metrics allow you to monitor and evaluate your work. The more you measure, the more you evaluate, the easier it will be to improve data quality.
Examples of data quality metrics you can implement
The dimensions we have presented above allow you to measure your data quality and your efforts from a quantitative point of view. The data quality metrics that we are now going to present will allow you to adopt a more qualitative approach in parallel. Here are some examples:
- Satisfaction indicators, obtained through surveys or polls, which allow you to measure the satisfaction of your employees with the data available to them.
- Productivity indicators, such as the evolution of the percentage of times the data governance department detects and eliminates redundant projects or initiatives.
- The measurement of risks and opportunities. For example, the benefits generated by the quality of the data or the risks materialised by the use of problematic data.
- Advances in competitive analysis related to improved data availability or improvements in data quality.
3 sources of poor data quality problems
Cleaning up data, fixing errors, filling in missing data, checking the accuracy of data are very important. But, as everywhere, prevention is better than cure, by identifying problems at their roots. Fixing problems at their source will help you avoid poor quality data. Never forget that maintaining data quality is not a one-shot job. It is a continuous and never-ending process.
Source #1: Mergers and acquisitions
When two companies come together, whether it is a merger (one entity being taken over by the other) or an acquisition (one being taken over by the other), the data follows the same pattern and is brought into contact or even merged. Just as when two people who have had children from a previous union get together, complications can arise. For example, it is possible, and even likely, that the two companies will use completely different data systems, different data collection methods. It is even possible that one of the entities has a database full of errors. It is advisable to set up a winner-loser matrix that allows you to decide, at each data entry, which one should be considered as “true”. This kind of matrix can, of course, be very complex and incomprehensible.
If you are faced with this situation, if a merger or acquisition is about to take place, get the IT department around the table to anticipate future difficulties and formulate an action plan beforehand – even before the signing.
Source #2: Migrating from one information system to another
For a non-technical user, it can be complicated to understand the difficulties inherent in changing computer systems. Yet it is a very complex operation. The transition from one system to another can be very tricky.
Some companies have been using the same database management systems for decades. For these companies, the moment of migration is often very difficult. This is linked to the technical characteristics of the information systems. An IT system consists of three parts:
- A database (= the data).
- The rules put in place and used to interpret the data
- The user interface, which determines how the data is presented to those who handle it (the users).
Each of these three aspects can cause difficulties when migrating from one IT system to another. The focus is usually on the data structure. We make sure that this structure is preserved. This is the wrong approach, because the rules of operation are often very different from one computer system to another. The result is that after migration, the data is incorrect in the eyes of the users, even though it may still be correct from a strictly technical point of view.
Our advice: in the context of a migration, it is not enough for your transition team to be experts in one or the other system. They need to be very familiar with both systems to ensure a smooth transition.
Source #3: User errors
This is a problem that will probably never be fully solved, as there will always be humans doing data entry and error is human. Everyone makes typos on a regular basis. This must be acknowledged and taken into consideration. Even the experts in charge of data cleaning make typos! If we cannot turn people into infallible robots, our simplest advice is to create forms that are easy to fill in. In this way, typing errors can be significantly reduced.
At a time of explosion in the volume of data used by companies, at a time of Big Data and the multiplication of contact points between the company and its customers/users, setting up a data quality management mechanism is an essential task. We hope that this guide has shed some light on certain points and provided answers to questions you may have had.