Churn is a fundamental measure for all businesses, and even more so in B2B where average baskets are generally higher. But it is often miscalculated, and misinterpreted.
The traditional formula of the number of customers lost over a given period of time does not take into account a number of important factors. Worse, it can be misleading.
How to calculate the attrition rate? How to optimise it? Which KPIs should you follow to improve your retention rate? We give you everything in this article.
Sommaire
Calculating the attrition rate: the classic formula![]()

Retention rate VS attrition rate
The customer retention rate allows a company to measure customer retention, i.e. the percentage of customers it has kept in the long term. The idea is to be able to optimise customer loyalty.
To calculate it, we suggest our super comprehensive guide to customer retention.
CRR is often contrasted with the churn rate, which is the percentage of customers a company has lost over a period of time.
The question of the unity of the retention rate
But in reality, customer retention is also measured by the churn rate. There is no real unit of retention rate, and you can calculate your customer retention with these different metrics:
- The customer retention rate, the formula for which is detailed in our guide to customer retention. The retention rate is always >1.
- Licence retention, which can be negative even for a company that is doing well.
- Finally, and this is the heart of the matter, the attrition rate, which unlike the CRR can be negative.
Going further
We can only recommend our comprehensive guide to customer retention.
The problem with the traditional method of calculating attrition rates
It is a bit complex but it is important to analyse the classic method of calculating attrition rate which is not always relevant because it makes a false assumption and will direct your efforts towards the wrong solutions.
A fundamentally false assumption …
The calculation of churn assumes that a customer always has the same probability of leaving at any time, regardless of the length of their subscription. This is very often not true. Moreover, having a constant churn probability over time means that you will have no customers left in the long term.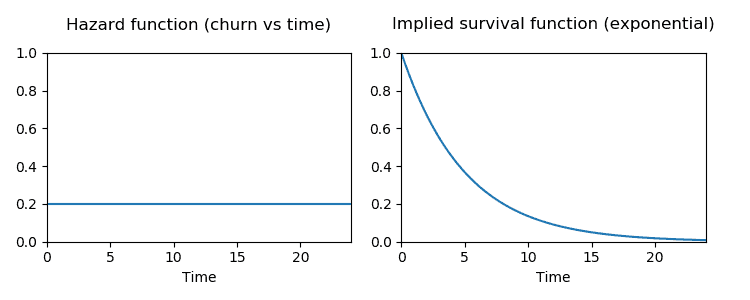
If the probability of customer churn is constant over time, this implies that the lifetime of customers is modelled by a geometric distribution.
If you have a constant churn rate of c per month, the probability that a customer will remain a subscriber for n months is (1-c)^n: This is the geometric distribution. If customers can leave the subscription at any time, we are in continuous time and we have to use the continuous time analogue: the exponential distribution.
What you need to remember is that it is very unlikely that a customer who has just become a customer has the same probability of cancelling as a customer who has been a customer for 3 years. And fortunately, otherwise your customers would have very short lifetimes.
The traditional method of calculating attrition rates completely ignores this fact, and assumes a constant probability over time, which can cause quite serious errors.
… which causes misleading figures
We now need to understand why correct modelling is important: to do this, we take two examples of a company that is doing badly and a company that is growing strongly to see what their attrition rates say when they are calculated incorrectly.
Keep in mind that in each of the examples below, we simulate lifetimes from the same distribution of client lifetimes, and that this distribution does not change over time.
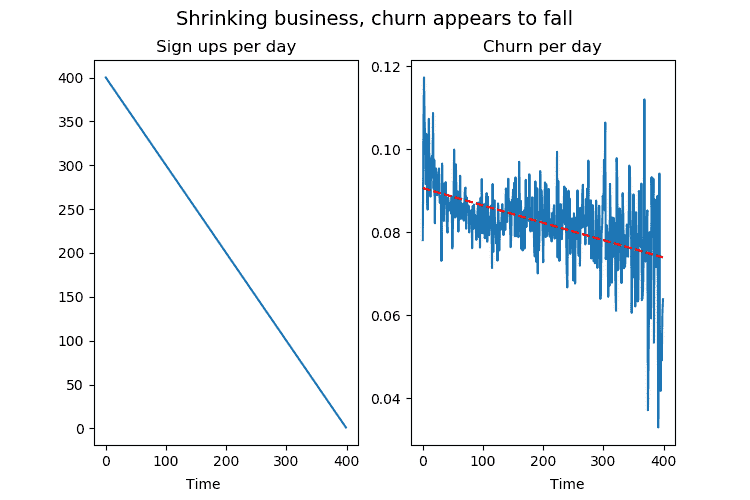
Example: a company that is doing very badly and where the number of new registrations per day is decreasing by one per day. How will this affect the churn rate?
With business declining, the churn rate seems to be improving as fewer and older subscriptions are being taken out.
This is clearly a company in a bad way, but if you look at the attrition rate, it looks great! The attrition rate per day is steadily decreasing, even though we know that the lifetime of customers does not change in our model.
This sharp drop in the churn rate is simply a consequence of the fact that the company is not getting new customers.
Also, because it’s not growing, a large proportion of its customers have been around for a long time and are therefore less likely to unsubscribe, which means that our churn rate goes down more than it otherwise would.
This change at the population level occurs even though there is no change in the life span of the underlying individual clients.
Second example: the scenario of a company that is going through a hyper-growth phase. The lifetime of its customers remains the same, but the number of new registrations per day increases linearly.
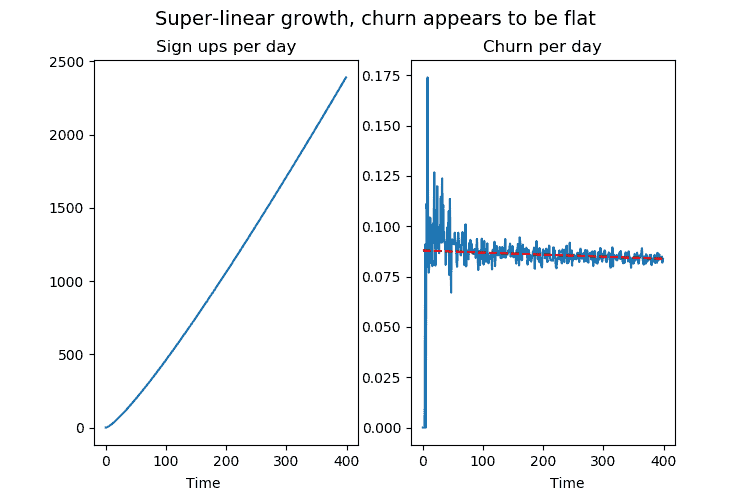
With a growing business, the churn rate seems to remain unchanged, only because most subscriptions are new.
Even if customer lifetime remains unchanged, the attrition rate graph is flat. An investor would frown and say that the company is not doing anything to improve its retention rate.
In fact, the only reason the graph looks “bad” has nothing to do with churn, it’s because we are incredibly successful at getting new sign-ups.
Relying on this measure for the company suggests that the retention rate is stable or even decreasing simply because it is polluted by the uneven distribution of customer acquisition over time.
In brief
The key point to remember is that this method of calculation only estimates the average age of customers, which is not at all representative of the health of a business if the distribution of customer acquisition dates is not constant. The growth or decline in the volume of customers acquired in one period has an impact on the measurement of the lifetime of customers in the next period, whereas these two elements should be independent.
Going further
If you would like a quick refresher on the different metrics to calculate to optimize your sales, we suggest :
Adjusted methods of calculating the retention rate
Ideally, you should do real stats to determine the probability at any given time that each of your customers will leave you for a competitor.
In real life, unless you have a huge number of customers, this is impossible. And even with lots of customers, you won’t be able to segment – which is fundamental to optimising your retention rates and making the calculation useful.
In practice, therefore, calculation methods are used which limit the margin of error:
1. The adjusted attrition rate
To adjust the attrition rate to account for significant monthly growth, one can start by taking the midpoint of the number of customers for the month, rather than using its value at the 1st of the month.
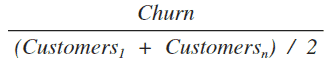
Here, the number of terminated customers is divided by an adjusted average of the number of customers over the entire study period to smooth out the effect of acquisition over the time of the study.
Advantages and disadvantages:
- This approach addresses the problem of growth by normalising changes in the total number of customers over time. You now have a more stable platform on which to base your churn, as the time window for total customers is the same as the one for churn.
- However, although this approach to calculating churn addresses the problem of growth, it fails to accommodate different time windows. Using the same calculation and data, you will get very different answers for daily, weekly, monthly and quarterly churn.
Example: let’s take the figures of an imaginary B2B Saas company as shown in the table below.
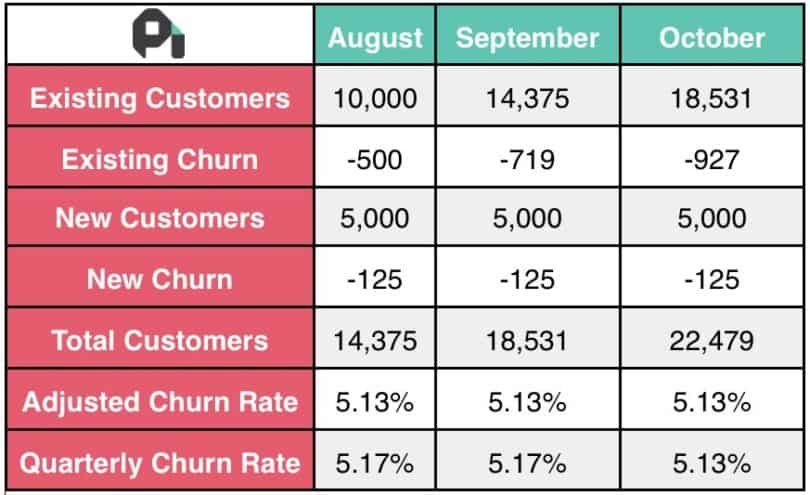
Even with a different number of customers at the beginning of each month, the following termination rates are obtained:
- August: 625 / 12,187.5 = 0.0513
- September: 844 / 16,453 = 0.0513
- October: 1052 / 20,505 = 0.0513
- Over the quarter: 2521 / 16,239.5 = 0.1552
The main problem with this approach to calculating churn is that it makes assumptions about the data. If you calculate this over 3 months, you get a churn rate of 15.52%. Divide that over the 3 months, and you get 5.17%, which is very close to the monthly churn rates for individual customers. So far, so good.
But what if you don’t have exactly the same numbers for each month? Let’s make August a bad month for our imaginary B2B SaaS company. This time, it only gets 100 new customers, 2 of whom unsubscribe.
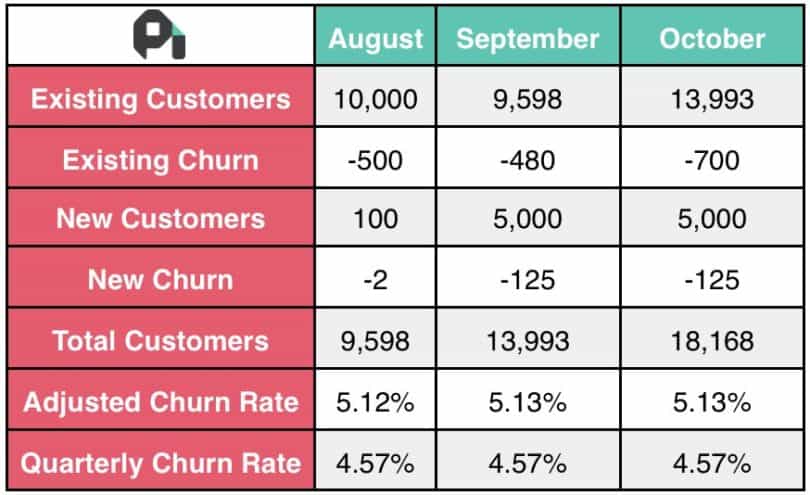
The churn behaviour is the same (5% of existing customers and ~2.5% of new customers), and when calculated individually, each month shows the same churn rate of 5.13%.
But when calculated per quarter, the 3-month churn rate is 13.72%, which when divided over each month is 4.57%.
- August: 502 / 9799 = 0.0513
- September: 605 / 11,795.5 = 0.0513
- October: 825 / 16,080.5 = 0.0513
- Quarter: 1932 / 14 084 = 0.1371
Now the monthly attrition rates do not correspond to the quarterly attrition rate, even though they use exactly the same data.
In brief
Churn is never that useful. A good churn rate should expand or contract with the length of the period it measures, while providing comparable results.
2. The calculation of attrition by cohorts

There are two types of cohorts: behavioural cohorts and acquisition cohorts.
Behavioural cohorts are grouped by specific actions that users perform in your product. They allow you to define a specific behaviour of course, but also a time period (during which this behaviour applies).
They are useful for understanding user behaviour towards your product, but to analyse attrition rates, we are primarily interested in acquisition cohorts.
Acquisition cohorts are based on when a user signs up for your product (quite simply, people who sign up in February, for example, are in the same cohort).
Acquisition cohorts can help you determine customer LTV, mean time to churn and other retention information.
To avoid acquisition bias in the measurement of churn, one can simply fix the acquisition and study cohorts by acquisition period to see how they change over time.
Every month, we look at all the cohorts acquired in M-1, M-2, M-3, … until M-12 in general.
Advantages and disadvantages:
- The big advantage is that it gives you a relatively simple way to calculate the attrition rate every month. For the time being, the calculation method presented initially works.
- The big drawback is that there are a lot of numbers to track instead of one magic KPI.
It’s also closer to operational reality, because it’s quite complicated to measure the impact of small actions on a big global KPI. With cohorts, you can quickly see what has an impact on retention.
Attention
Each cohort can be very different for a variety of reasons. You will always be tempted to attribute it to actions you have taken (changes in supply, price, etc.) but be careful to think about exogenous factors too. For example: over or under investment by a competitor in a given month, seasonality, current events, etc.
Going further
Want to manage your customer relationships better?
- All you need to know about CRM
- Why use a commercial CRM?
- The detailed comparison of the best CRM software.
KPIs to monitor to improve your retention rate

1. The NPS score
The Net Promoter Score is an indicator of overall satisfaction and brand loyalty. By calculating your overall NPS, you know whether your consumers are satisfied with your products or services and willing to recommend them to others.
Created by Bain & Co, NPS has moved beyond simple measurement and is now used as a company-wide system to drive customer focus. It estimates the potential growth through customer retention and referrals by comparing your score to your revenue growth rate and customer attrition rate.
Unlike most measures, NPS is calculated from a common question in customer surveys: “How likely are you to recommend our company to a friend or colleague?”
Customers are asked to rate how likely they are to recommend your business to their family and friends on a scale of 0-11. Customers are divided into three categories according to the scores they give:
- Promoters: 9-10
- Liabilities: 7-8
- Detractors: 0-6
Once the customer scores are recorded, use this formula to determine your NPS:
Net Promoter Score = %Promoters – %Detractors
2. The rate of repetition
The repeat rate, or repurchase rate, is the percentage of customers who repeatedly buy other products and services from your company, a good indicator of customer loyalty.
A useful application of this measure is to capture data for different customer demographics. The results can help you refine customer personas and improve marketing to these target audiences.
The repeat rate can be calculated for any period of time, making it useful for looking at small windows of time or an overview. To determine your repeat rate, use this formula:
Repeat purchase ratio = Number of repeat customers / Number of total customers
3. The income generated by each (acquisition) cohort
Knowing the revenue generated by each acquisition cohort is critical to your business.
- If it’s up, it shows that your teams and campaigns are successful and that your customers are getting significant value from your business.
- If it is stagnant, it means that you need to spend more money and effort on customer retention andaccount-based marketing.
- If the figure is falling, your business may be in trouble – so you need to find out what’s wrong and fix it, quickly.
To calculate the revenue growth rate of your existing customers, you need to know the monthly recurring revenue (MRR) of your existing customers, not including new sales. The formula is as follows:
Growth rate of turnover of existing customers = (RMR at end of month – RMR at start of month) / RMR at start of month.
3. Payback
Finally, you can calculate the recovery period of the CAC and the debt. Debt takes many forms within a company. It can be a bond or a traditional long-term bank loan. Usually there is a principal balance that you pay back over time, as well as some type of interest.
But one can also imagine that customer acquisition costs (CAC) are another form of corporate debt with a twist: you have a balance or principal amount, the amount spent to acquire a new customer, and an interest component. In this case, the interest represents the opportunity cost of money tied up in CAC that could have been spent elsewhere (for example, on a new product).
This is a metric that receives little attention, even though it is extremely important for a company in a context of strong growth.
To calculate it in a meaningful way, you have to project the existing income of a cohort, which can be problematic because it assumes a known attrition rate. Except that you don’t know it precisely because you are working on it (you are trying to bring it down).
In practice, you can use two or three approximations depending on your churn curve. In SaaS for example:
- The attrition rate is usually very high at the beginning of the customer relationship (onboarding).
- It then stabilises much lower (fortunately) at around 3-5% from the 3rd or 4th month.
- The other key point is usually the 13th month where it increases disproportionately due to annual non-renewals, and the significantly different purchase cycle (the attrition rate being effectively zero on these subscriptions the rest of the time).
In order to project the income of each cohort into the future, it is really necessary to take into account these structuring assumptions and retroactively validate the assumptions made for each cohort.
For example, in the March 2022 reporting, the retention rate of the December 2021 and March 2021 cohorts is validated and the assumption for the following months is adjusted if necessary.
Going further
Need advice on how to improve customer loyalty?
- The best customer support software
- Maintain your customer relations at a trade fair
- Turn your customers into ambassadors to improve your customer acquisition cost