Here you will find the key steps to build successful sales forecasts based on objective & quantitative data.
Regardless of the stage reached by the opportunities in the sales funnel, sales representatives and managers are asked to make a qualitative assessment of their opportunities. This is an approach that relies mainly on intuition. Relying on hard data limits several important biases.
Sommaire
6 steps to building good sales forecasts
1. Standardise your sales funnel
In order to build more accurate sales forecasts, the first thing to do is to define the different stages of your sales funnel as objectively as possible.
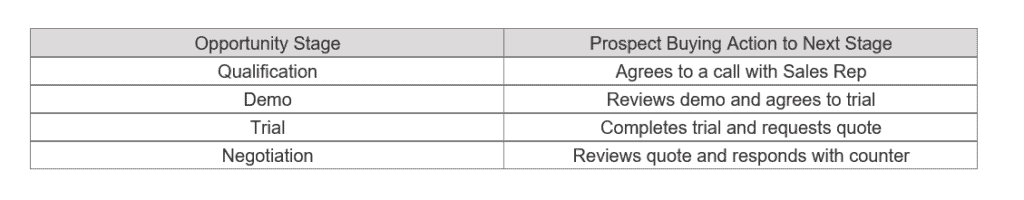
Start with a clearly defined sales process and formal definitions of each step in the sales funnel. The definition of steps should be driven by the buying process, not the selling process – even if the salesperson does everything right, their steps do not reflect the likelihood of the customer buying.
It is essential to define and document all of your sales processes to ensure that the sales team has a good understanding of the qualification rules, your sales system and the different steps an opportunity must go through to close.
source: insightsquared.com
The steps should cover the entire sales funnel from “New” to “Lost/Won”. You should not have any opportunities that are not in one of the stages. They must be distinct enough that you do not see two stages occurring together; otherwise, there is not enough differentiation between them to be meaningful.
By defining these stages, you will be able to measure the percentage of opportunities that reach the “Lost/Won” stage. You will be able to access this information through most powerful CRM software.
2. Calculate your historical conversion rates at each stage of your sales funnel
Knowing the historical conversion rates of your sales stages is essential for effective and objective sales forecasting.
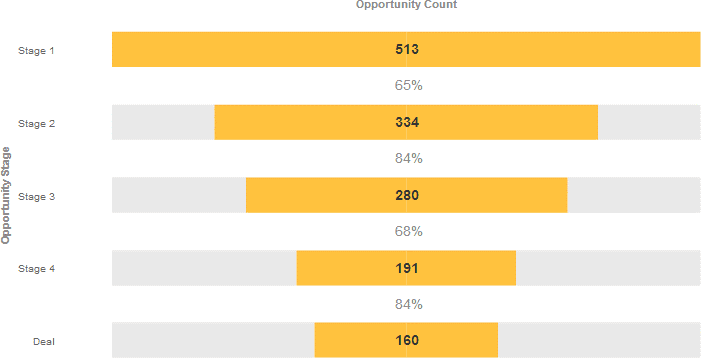
Figure 2 below shows a sales funnel and displays the conversion rates from one stage to the next. It allows the sales manager to understand the nuances of the value of the pipeline, its evolution over time and the most important stage where his or her teams should focus their efforts.
For example, in Figure 2 below, only 31% of all opportunities move from stage 1 to “Deal”, while 84% of stage 4 opportunities will turn into a Deal for your organisation. Studying your sales funnel history accurately is an essential first step in understanding your team’s performance in the short and long term.
source: insightsquared.com
With this information, you can quickly move from estimating which opportunities will close to a more accurate prediction of the value of each opportunity based on size, salesperson and stage. These historical win rates allow you to estimate the value of a deal more realistically based on past history.
Going further
Once you have defined these different stages of the conversion funnel by following the customer journey, you can look at the sales process that takes each prospect from one stage to the next, in order to optimise these conversion rates. If it is not formalised, try to formalise it. For example: 3 emails & a call after a product demo. Beyond that, the opportunity is lost.
You can start by doing this for a whole team, and gradually segment. By region for example, until you get to the level of each salesperson to optimise their performance.
3. Define the key indicators that determine your sales forecasts
The data-driven forecasting method looks at the conversion rates at each stage, and simply multiplies the opportunity values by these rates. It is more mathematical, but does not take into account the nuances in your pipeline. Your team should also consider your conversion rate from start to finish, or by opportunity.
4. Require estimated closing dates & track date changes
Most CRMs have a “Closing Date” field that allows your salespeople to enter their own predictions about when a transaction will close. Look for examples where the closing date does not match the data (current stage + sales cycle from that stage).
Sit down and talk to your salesperson to find out what’s going on. Even if your whole organisation likes numbers, you can’t ignore all the subjective data your salesperson collects throughout the process.
Demand accurate and up-to-date data from your sales people and hold them accountable for all their opportunities. All the forecasting tools in the world can’t help you make correct forecasts if you don’t have reliable data to analyse.
5. Know how accurate your salespeople’s forecasts are
Past performance is a leading indicator of future performance. Knowing the accuracy and historical performance of each of your salespeople will help guide them and help them adjust their forecasts for better accuracy based on their current business profile and historical data.
6. Separate your forecasting meetings & your sales pipe review meetings
Successful sales managers need to differentiate between sales pipeline review meetings and sales forecast meetings. Although they are both intended to monitor sales, key indicators and strategy, they should each have a distinct purpose and focus.
The purpose of pipeline review meetings is to ensure that there are sufficient leads at each stage of the sales funnel. They are often less frequent than forecast meetings as they address internal processes, not the customer.
Sales forecasting meetings should be held weekly, ideally on Mondays, and during this meeting a sales manager should inspect each deal (especially at the bottom of the funnel) and help the sales people to close the deals in hand.
6 indicators to follow for an effective sales forecast
1. Commercial funnel stage
Look at the stage your opportunity is at. Based on the elements we detailed earlier, you should now know what conversion rate applies to each stage and have a clear idea of the likelihood of converting the opportunity into a deal at that stage. Keep an eye out for leads that make little or no progress in your sales cycle, as this is an indicator that the opportunity may be missed. If all is going well traditionally, leads progress faster and faster through your sales funnel.
2. The age of opportunity
You probably have a number of opportunities that are no longer relevant and should have been eliminated from your database. If the opportunity is 2 or 3 times longer than your typical average sales cycle, your opportunity is “at risk”. Sales managers need to know their sales cycle and look at how long a successful opportunity stays at each stage, then compare it to their current opportunities.
If successful leads usually go through the first stage in just a few days and your current pipeline averages a month, it’s a clear sign that you need to eliminate those opportunities that are no longer relevant. In your forecast meeting, you can now have this objective conversation with your sales person.
3. The potential of opportunities
Salespeople usually focus on the big deals and sometimes lack the objectivity to be attracted by the possibility of a big sale. As a result, most organisations waste time on big opportunities that were never realistic to begin with.
Effective managers need to review their win/loss analysis and then look at success rates for large opportunities. There is usually a big gap between these two figures, so you should discuss these large or high-potential planned opportunities in forecast meetings and ask each salesperson for more objective data on why they think they will happen.
4. Commercial actions carried out
Know how much effort has been put into a lead – this can be measured by tracking the activities your sales people have to record in your CRM. In addition, you should apply some of the principles of ‘activity-based costing’ and measure some of your activities as more effective and impactful than others: for example, a product demonstration or trial would mean much more than just cold calling.
If a lot of effort or activity has been invested in a lead, it is more likely to materialise, but it is important to monitor the ‘quality’ or type of activity and not just the ‘quantity’.
5. Prospect engagement
By looking at the tasks or activities carried out on the lead over the last 2 weeks (or 10 working days), you will know if it is stalled or not. If there is no activity and it is scheduled to close this month.
This is an indicator that the opportunity is at risk. If you have a traditionally longer sales cycle, adjust this threshold based on your historical data, but continue to monitor for declines in engagement.
6. The estimated closing date
When looking at opportunities, if you see that the closing date of a deal or opportunity is repeatedly pushed back, then the opportunity is at risk. Another barrier to accurate sales forecasting is that lead lag should be a key indicator that opportunities are stalled.
Feel free to use the following resources to optimise your business processes
- The 10 commercial performance indicators to monitor
- How to create a solid sales action plan?
- 7 examples of business proposals
- 4 methods for creating a sales forecast