You have no idea what ChatGPT says about your company when a prospect asks it for advice. HubSpot offers a free tool to find out in two minutes: the AEO Grader queries three AI engines about your brand and gives you a score.
We ran it on noCRM to test it, and then we read the entire report, right down to the footnotes.
In this article, we share the results of our comprehensive test. Find out what we think of HubSpot AEO Grader (or “AI Visibility Audit” in French).
Sommaire
HubSpot’s AEO Grader in Two Minutes
The AEO Grader is part of HubSpot’s family of free tools, alongside the website analyzer and the persona generator. It promises to measure how AI-powered response engines talk about your brand.
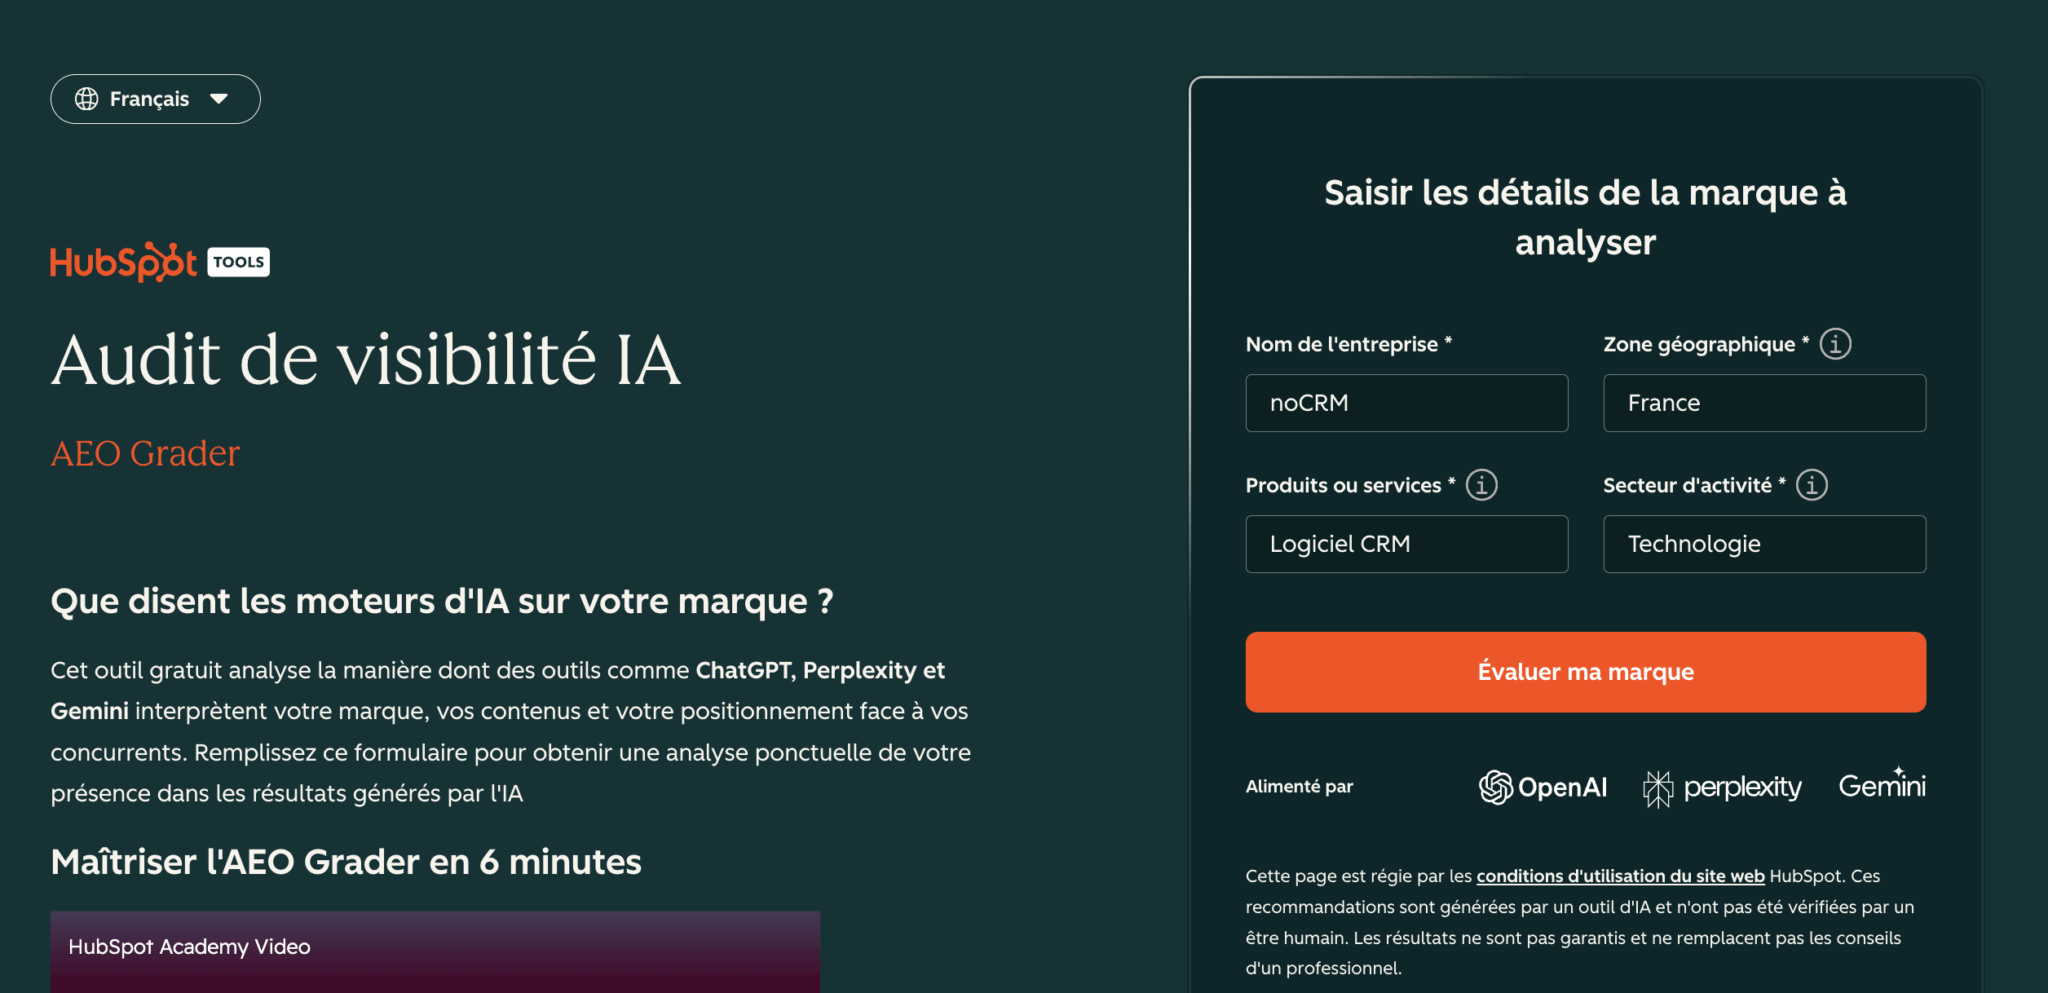
The form consists of four fields: company name (not the website URL, since here we’re analyzing a brand and mentions, not a website), geographic region, products or services, and industry. When you click, the tool queries OpenAI, Perplexity, and Gemini before displaying a score for each engine in just a few seconds.
This score combines five dimensions, with weightings that speak volumes about the tool’s philosophy:
- Brand perception, scored out of 40 points. This is by far the most significant factor, because HubSpot considers the way AI talks about you to be more important than simply knowing who you are.
- Brand awareness and the quality of thebrand’s presence, each worth 20 points.
- Exposure (your share of voice compared to competitors) and market position, each scored out of 10 points.
Scores are displayed instantly, but accessing the detailed report requires an email address and includes a checkbox to opt in to being contacted by a sales representative. It’s a clear lead magnet, just like all of HubSpot’s free tools over the past ten years, but the report you receive is well worth the email.
Be careful not to confuse this with HubSpot AEO, the paid tool launched in April 2026. The Grader is a one-time, free assessment. HubSpot AEO is a continuous monitoring platform priced at €49 per month, with 25 tracked metrics and 10 monitored competitors. The former answers the question “Where am I today?”, while the latter answers “How is it changing?”
Our HubSpot AEO Grader test on noCRM: three engines, three verdicts
For this test, we chose a brand that our readers are familiar with and that we do not publish: noCRM, which is positioned as “CRM software” in France’s technology sector.
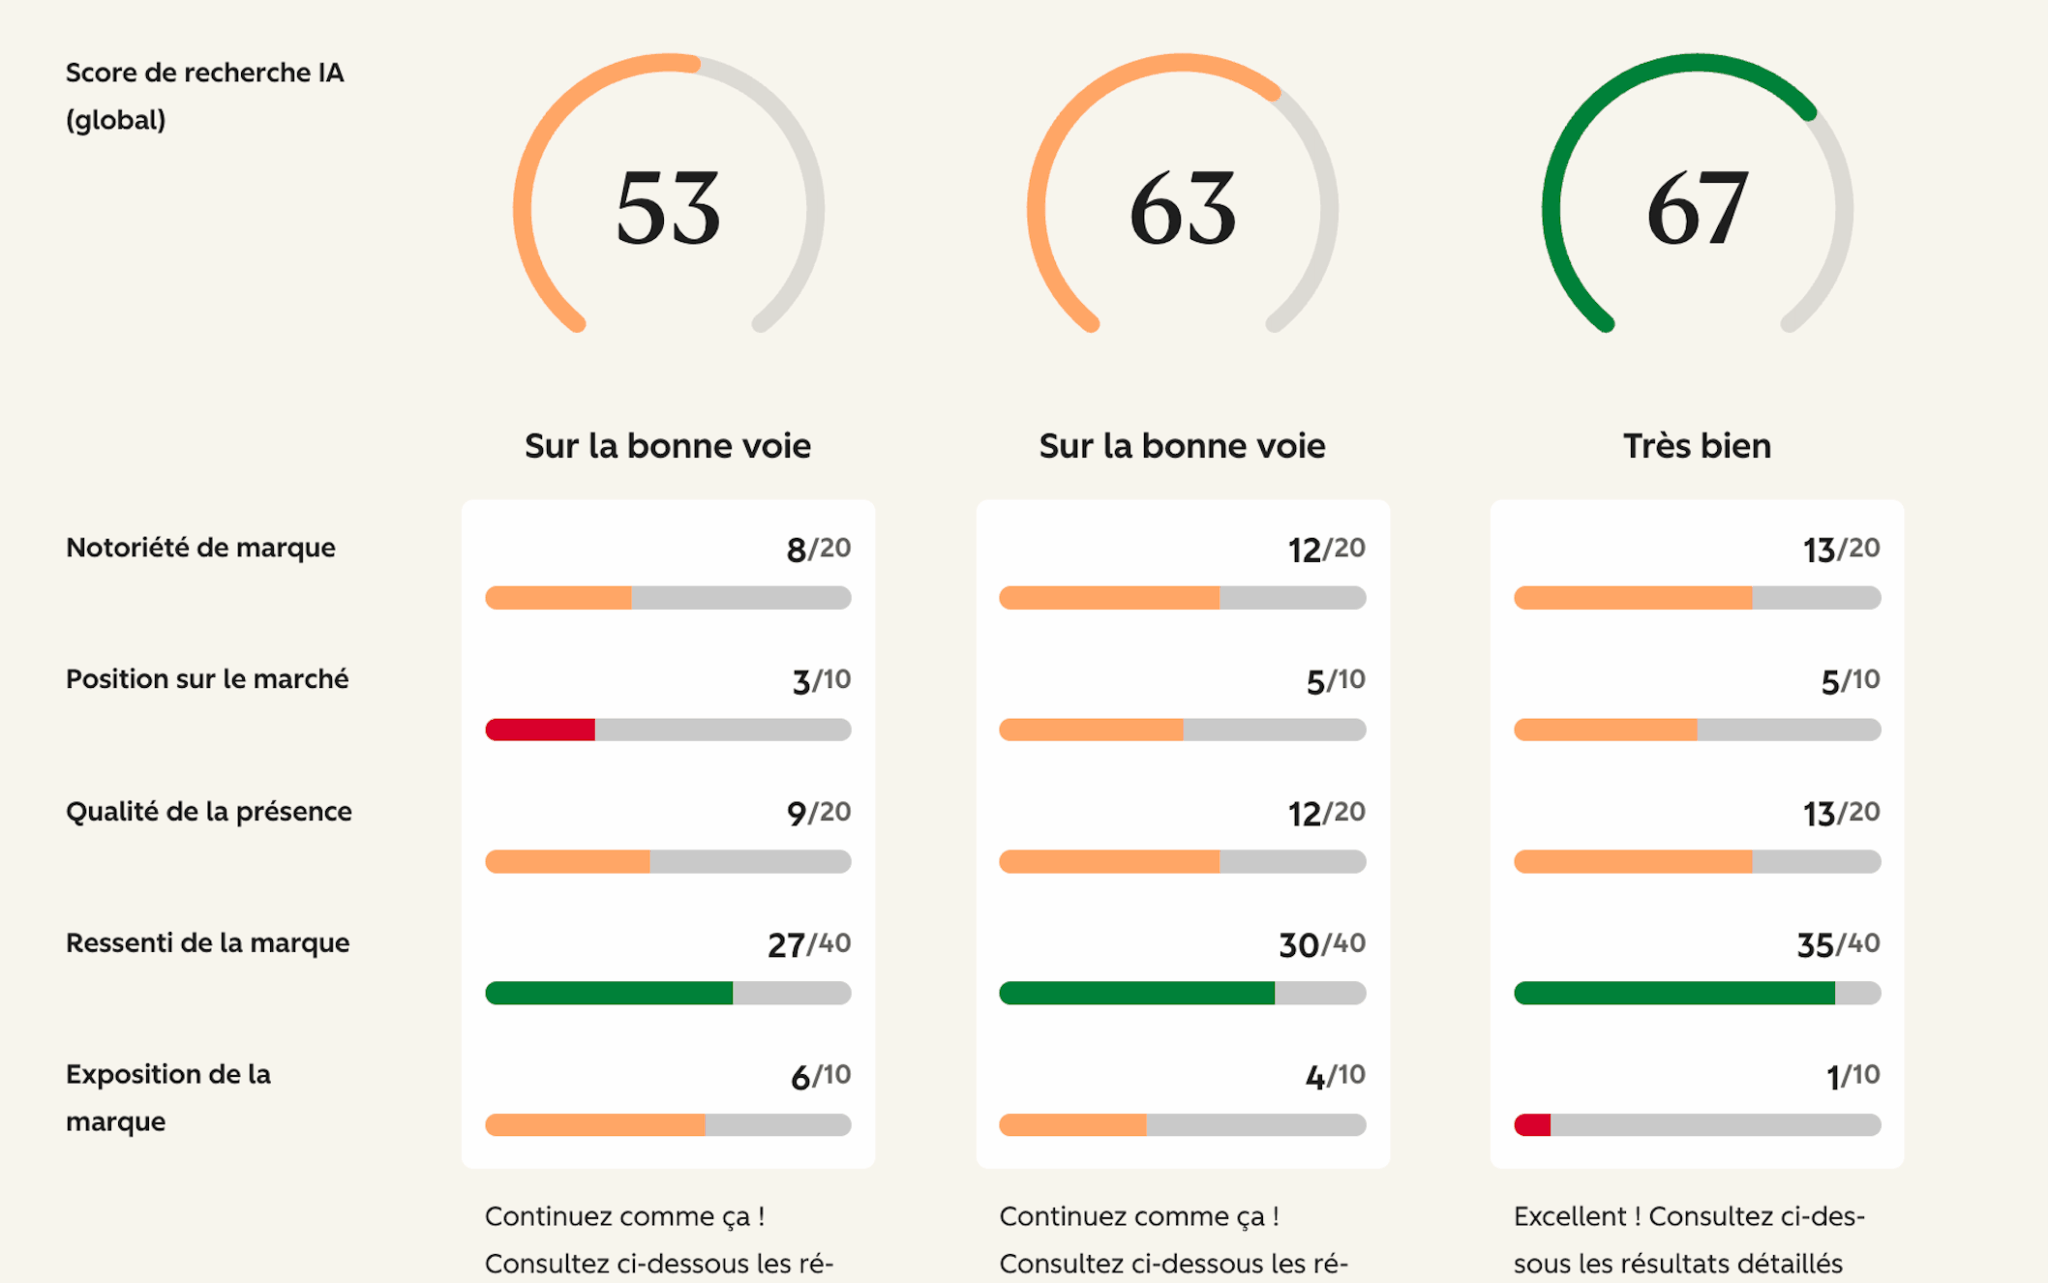
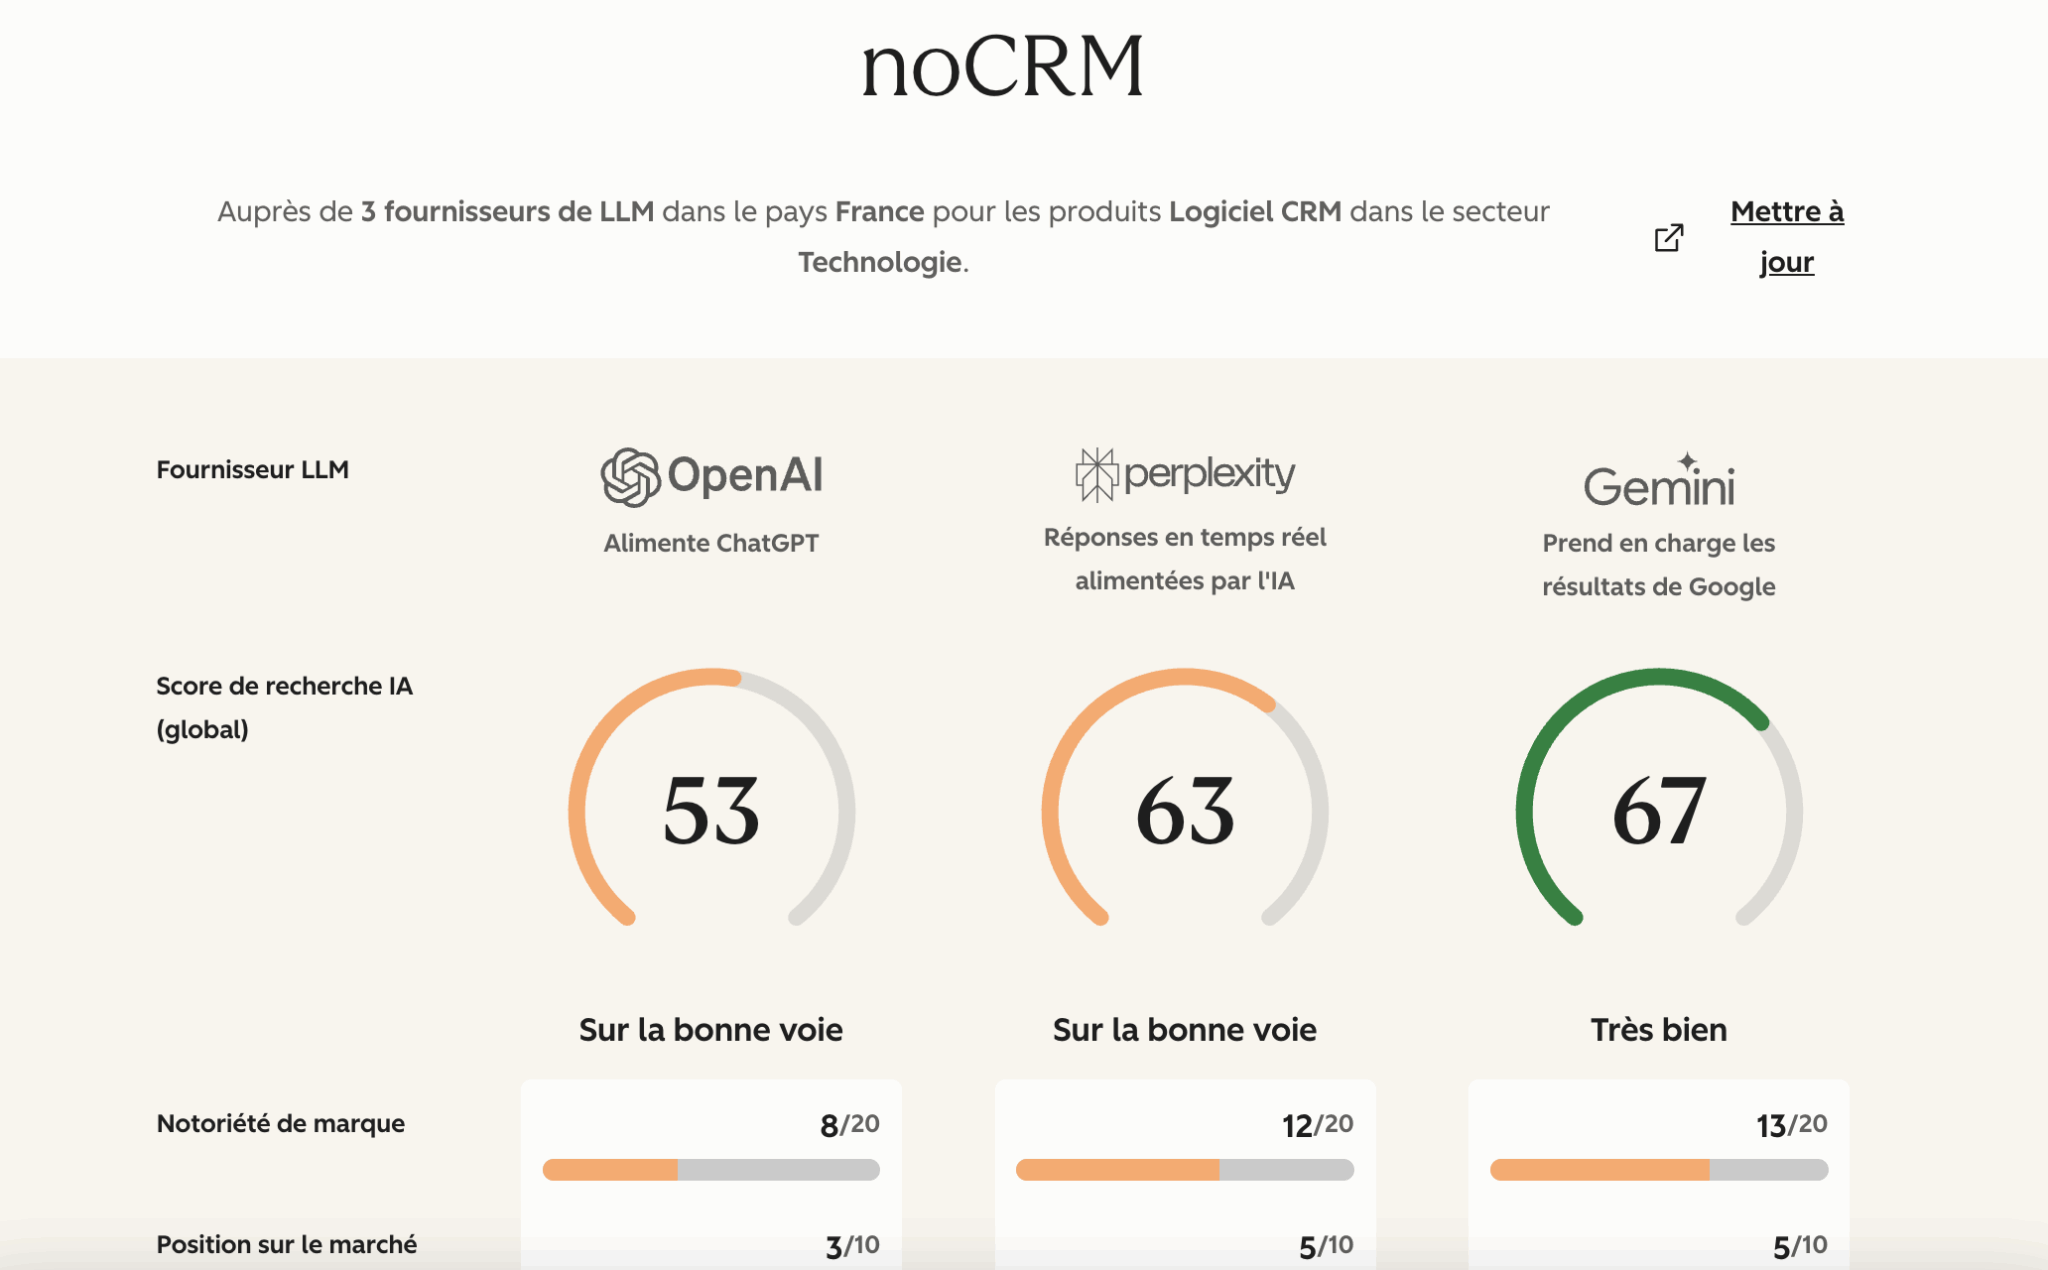
First takeaway: The tool doesn’t return one score—it returns three. One per engine. And the difference is far from negligible.
| Dimension | OpenAI | Perplexity | Gemini |
|---|---|---|---|
| Overall Score | 53 | 63 | 67 |
| Brand Awareness | 8/20 | 12/20 | 13/20 |
| Market Position | 3/10 | 5/10 | 5/10 |
| Quality of Presence | 9/20 | 12/20 | 13/20 |
| Brand Perception | 27/40 | 30/40 | 35/40 |
| Brand Exposure | 6/10 | 4/10 | 1/10 |
Fourteen points separate the highest score from the lowest. Translated into a qualitative assessment, this translates to “on the right track” for OpenAI and Perplexity, and “very good” for Gemini.
Now, look at the last row of the table. It reveals something counterintuitive that the overall score completely masks.
Gemini gives noCRM its highest sentiment score, 35 out of 40, and its lowest mention rate, 1 out of 10. OpenAI does exactly the opposite: the lowest sentiment score in the panel, 27 out of 40, but the highest mention rate, 6 out of 10. In other words, ChatGPT mentions noCRM relatively often but speaks less favorably of it, while Gemini speaks very highly of it but almost never highlights it over its competitors.
This is the most useful insight in the entire report, and you have to dig for it. A high sentiment score combined with low exposure means “liked but invisible”: the focus should be on increasing visibility in comparative content and category pages. A low sentiment score combined with adequate exposure means “visible but poorly communicated”: the focus here is on the sources that drive that sentiment—customer reviews, quantified use cases, press coverage, etc. Two opposing diagnoses, two opposing action plans.
Why do the scores differ so much? The answer is in the footnote.
We could have stopped there and concluded that the three search engines perceive the same brand differently. But that would be missing the point.
The PDF report ends with three lines of small print—which are easy to overlook—that specify the models surveyed and, most importantly, the date their data became outdated.
| Engine | Model used | End of information |
|---|---|---|
| OpenAI | GPT-5.4 mini | August 31, 2025 |
| Perplexity | Real-time search | None, active web browsing |
| Gemini | Gemini 3 Flash Preview | January 2025 |
It is July 2026. Gemini, therefore, evaluates a brand based on an 18-month-old dataset, OpenAI on an 11-month-old dataset, and only Perplexity looks at today’s web.
Part of the discrepancy between the three scores therefore does not reflect a difference in perception among the algorithms. It reflects a time lag. Specifically: a company that launched a major product, raised funds, or repositioned itself in 2026 will appear weak on Gemini and average on Perplexity, even though its actual visibility has nothing to do with this discrepancy.
Two important points need to be clarified:
- First of all, this limitation isn’t unique to HubSpot: any GEO measurement tool relies on models that are fixed as of a specific date, and most of its competitors don’t mention this anywhere. HubSpot does, even if it’s in the fine print, and that’s actually to its credit.
- Second, the models used are fast, streamlined versions—mini and flash—which makes sense for a free tool that needs to respond in a matter of seconds, but is still different from what a prospective user gets in the consumer interface of ChatGPT or Gemini.
In the full report, the text speaks louder than the numbers
You can request the detailed report by providing an email address, then download it as a PDF or share it with your team via a link. It contains significantly more information than the on-screen preview.
After poring over it, our takeaway can be summed up in one sentence: the statistical data calls for caution, while the qualitative analysis is excellent. In other words, it’s exactly the opposite of what the layout suggests.
This calls for caution
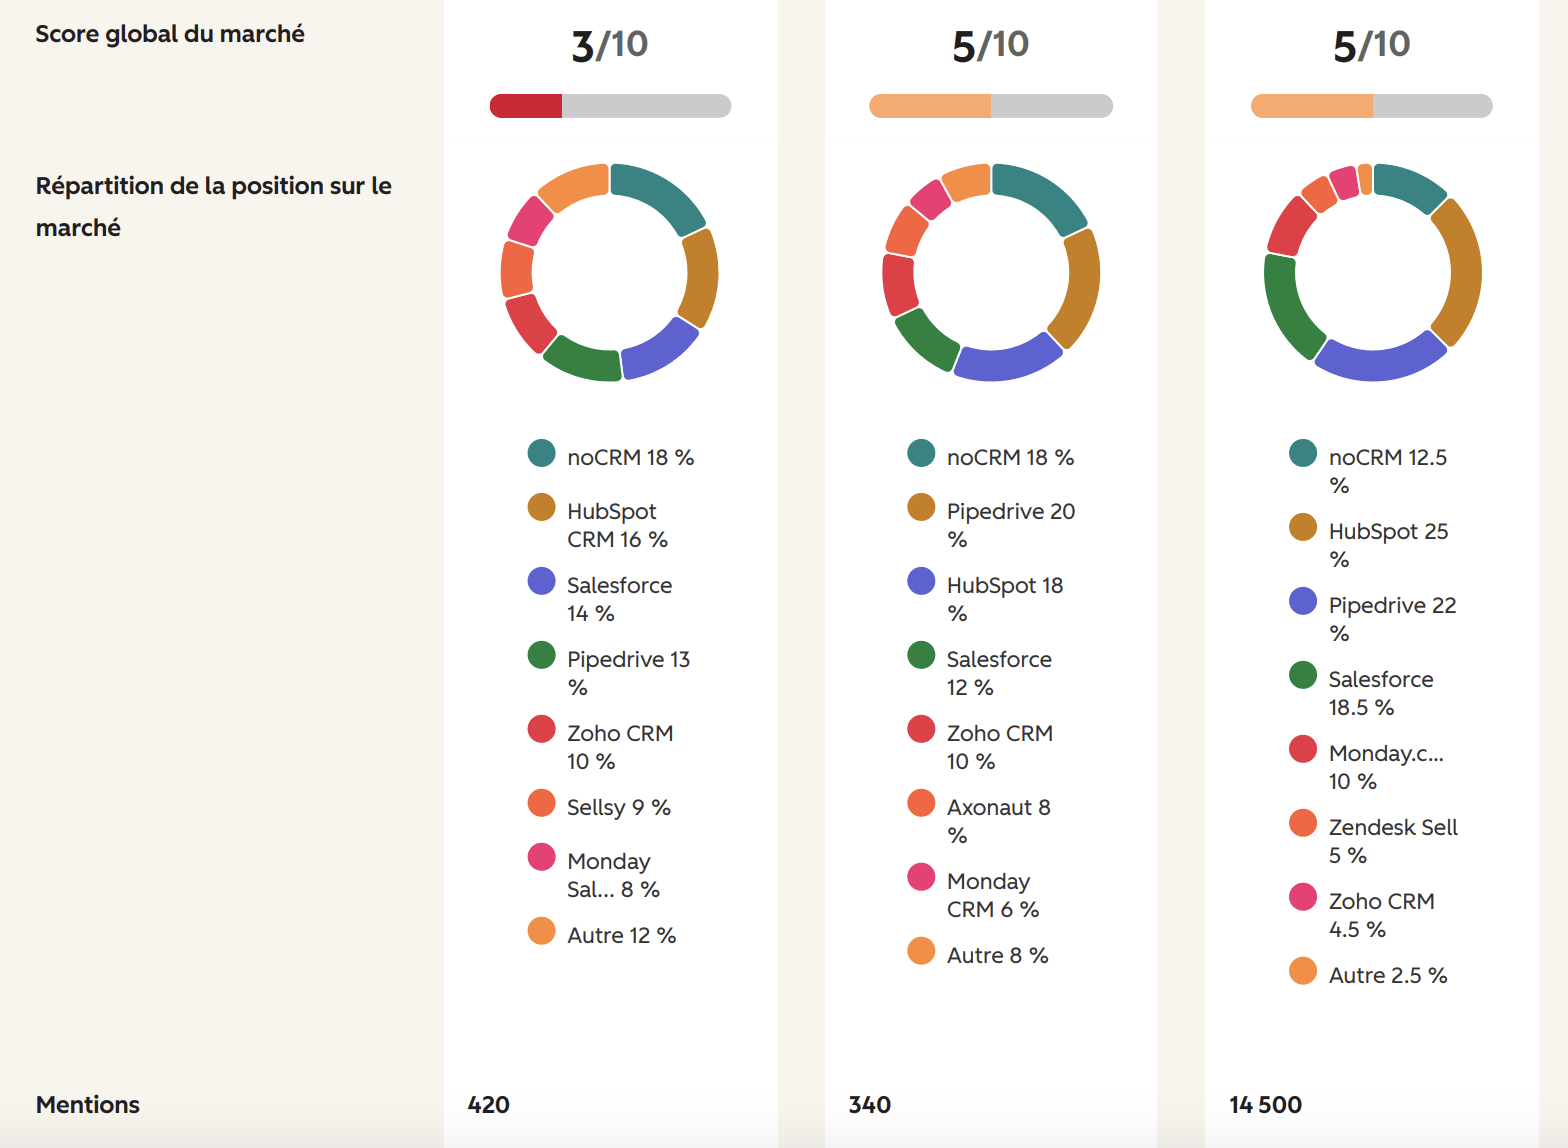
- The volume of mentions. The report lists 420 mentions for OpenAI, 340 for Perplexity, and 14,500 for Gemini. That’s a factor of 43 for the same brand on the same day, with the highest volume attributed to the engine with the oldest corpus. These orders of magnitude are not comparable to one another.
- The market share pie chart. Two factors place noCRM at the top of the French CRM market with an 18% share, ahead of HubSpot and Salesforce, even though the three columns describe noCRM as a niche player just a few lines earlier. There’s an explanation for this apparent contradiction: the chart measures the share of voice in AI responses to the tested queries, not actual market share. This distinction is crucial and worth keeping in mind.
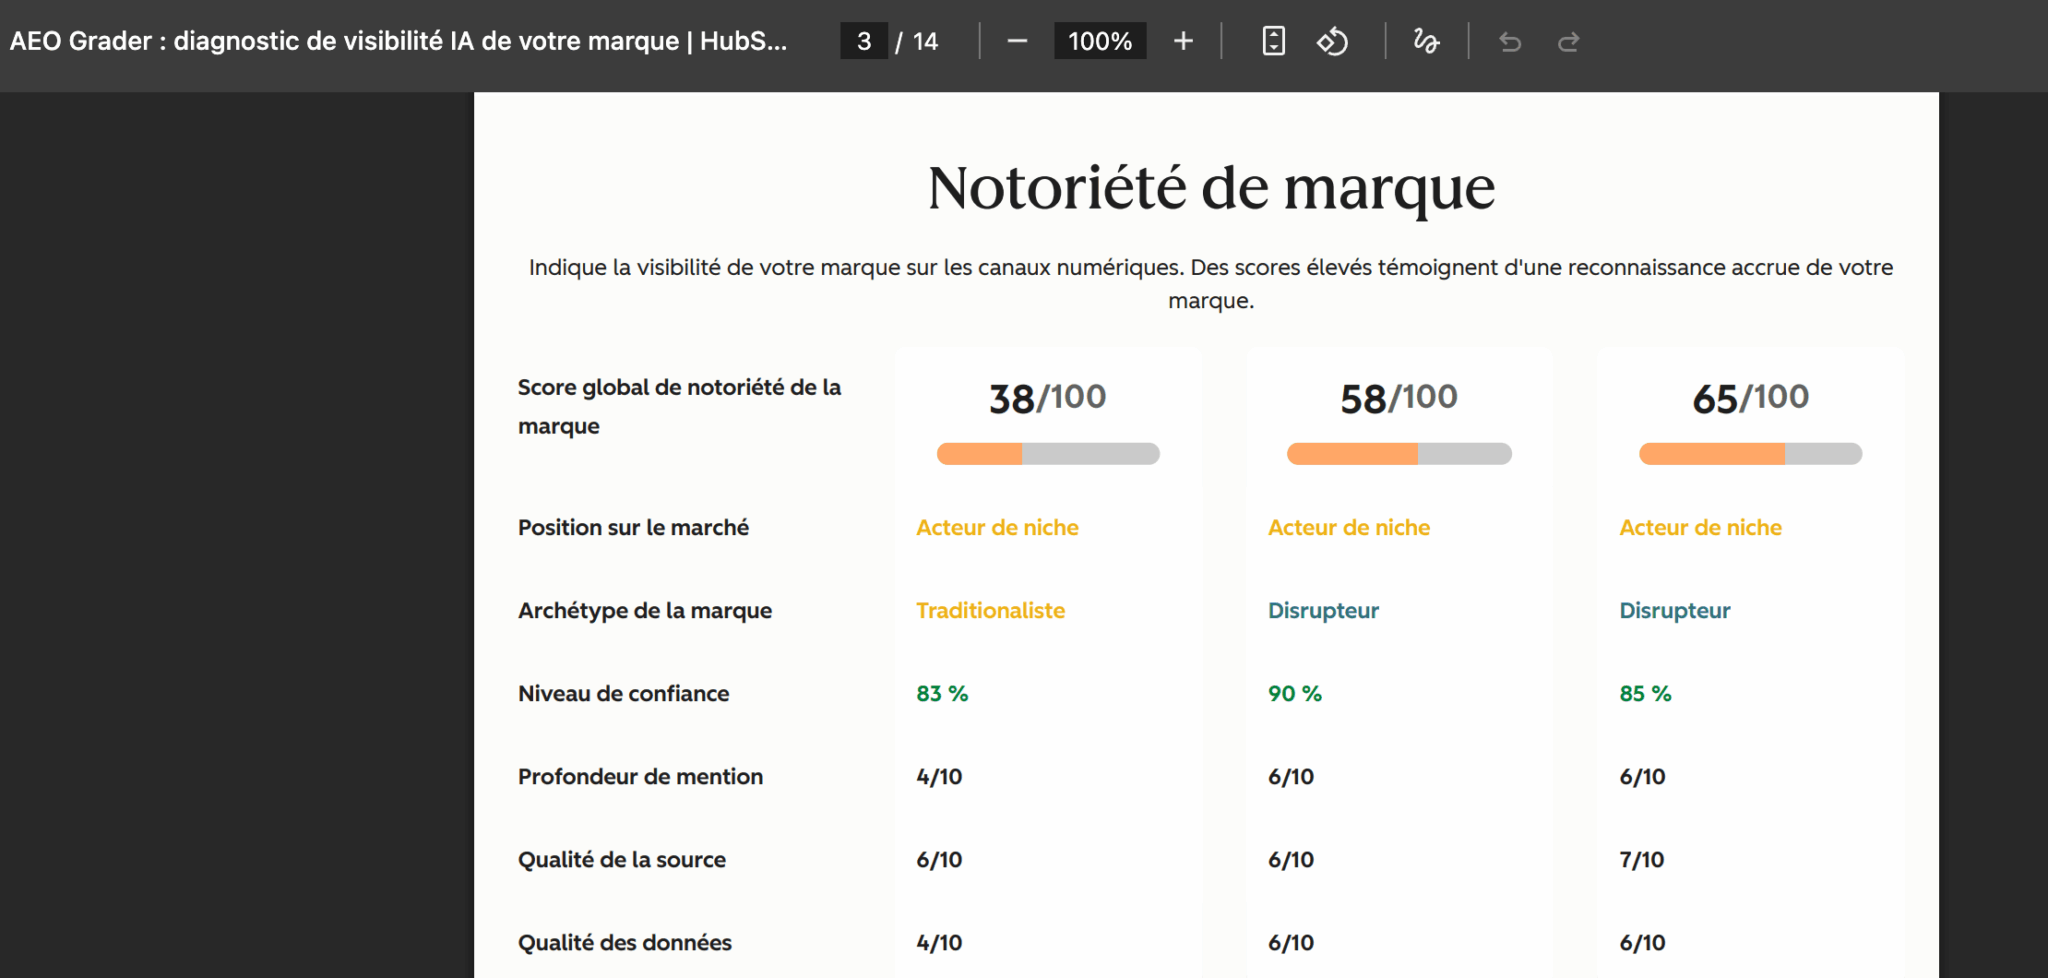
- Confidence levels. They range from 83% to 90% for conclusions that differ significantly. A high level of confidence reflects the internal consistency of the analysis, not its accuracy.
- The brand archetype. OpenAI classifies noCRM as a “traditionalist” and Perplexity and Gemini as “disruptors.” For a brand whose entire positioning is based on an “anti-CRM” approach, the first label is surprising and clearly illustrates the impact of the available corpus.
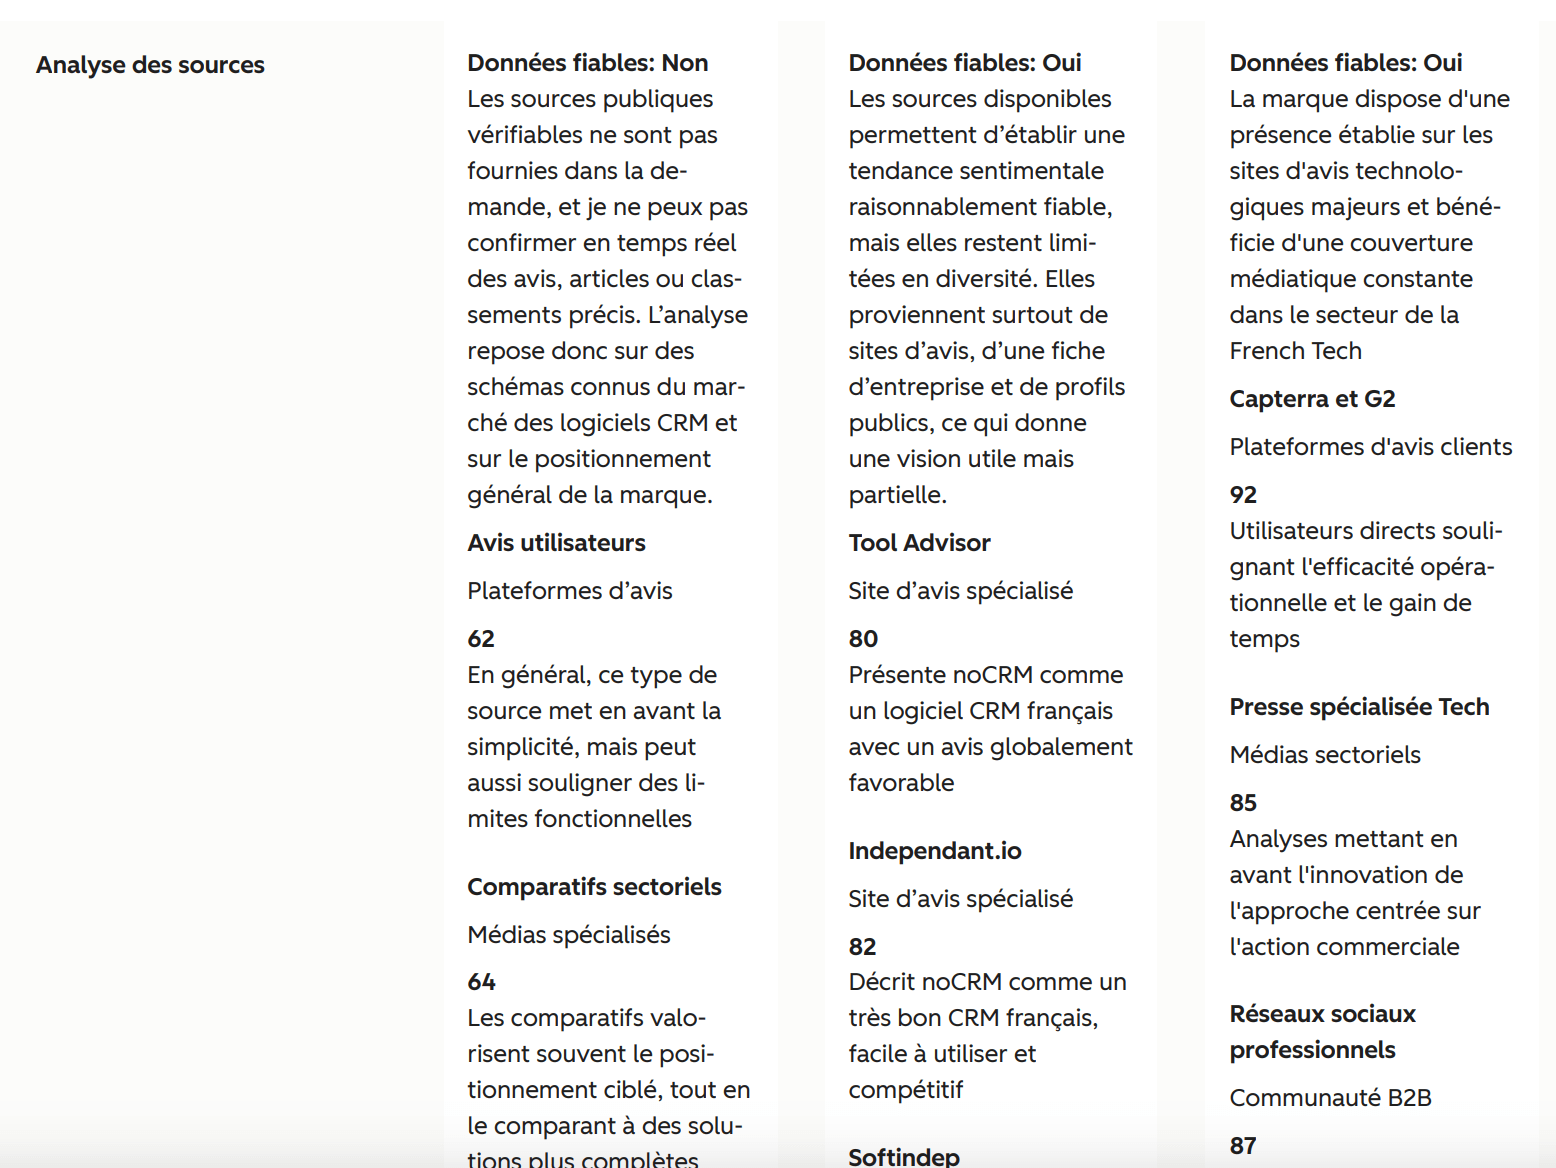
It’s worth noting one point that speaks in the tool’s favor: the “source analysis” section explicitly states, for OpenAI, that reliable data is not available and that the analysis is based on patterns known in the CRM market. The tool therefore indicates when it is extrapolating. You still have to read it, but the information is there, and many competing tools do not display it.
It holds up very well
- The sources cited. Perplexity provides a detailed list of the pages that inform its assessment, along with a score for each source: specialized review sites, the company’s LinkedIn profile, app store listings, and SaaS databases. You can open them one by one and check them out. This is the most immediately actionable part of the report.
- Narrative themes. The three key points align: a simple, sales-focused CRM; a lightweight alternative to traditional CRMs; an “anti-CRM” approach centered on sales activities; and a French solution founded in Paris in 2013. Anyone familiar with noCRM will recognize this as an accurate summary. This is valuable because these are the phrases that will stand out to your prospects.
- The polarization indicator. Rated 38, 28, and 15 depending on the search engine, this metric measures whether the market is divided in its opinion of you. A low number indicates consensus, while a high number suggests divided opinions. Few tools offer this insight, and it is strategically useful.
- Areas of Growth. Strengthen differentiation from general-purpose CRMs, expand the integration ecosystem, and better serve growing teams. It’s not revolutionary, but it’s sound, consistent across platforms, and directly translatable into a content roadmap.
Our reading tip: Start with the narrative themes and the list of sources, not the metrics. The phrases that the AI uses to describe your brand—and the pages that feed into them—give you an immediate action plan. The scores, on the other hand, serve primarily as a directional guide and a point of comparison with competitors.
The best way to use this tool isn’t what you think
Here’s what the product page states in a simple FAQ question, even though this is by far the most profitable use case: the AEO Grader accepts any brand.
In fact, we’ve just demonstrated this. noCRM is not our brand, and nothing prevented us from conducting a full audit of it.
So you can scrutinize your competitors—for free—as many times as you like. For each competitor, you’ll see the exact phrases the AI uses to describe them, their strengths as perceived by the market, the archetype associated with them, the sources that shape their reputation, and their share of voice compared to yours.
Set aside thirty minutes and run the audit on your brand and then on four competitors, strictly maintaining the same parameters for geographic area, product category, and industry. Without identical parameters, the comparison is worthless. You’ll then get an analysis framework that very few marketing teams have access to today: who’s being mentioned, on what topics, and from which sources. This is the kind of competitive intelligence work that would have taken several days just two years ago.
Taking a Step Back: Where Does GEO Really Stand in 2026?
A score without context is meaningless. Here is the context in which this tool is used.
#1 The shift is structural
B2B buyer behavior has changed faster than acquisition strategies. Nearly 60% of Google searches now end without a click, and ChatGPT has surpassed 900 million weekly users. At HubSpot, organic customer traffic has declined by 27% in one year, while visitors referred by AI platforms convert 4.4 times better than traditional organic traffic. In France, the arrival of Google’s AI Overviews has completed the shift in the last major French-speaking market.
The result is simple: your prospect may form an opinion about your industry, rule out your brand, and choose a competitor without ever visiting a single website.
#2 A Booming Tool Market
The sector grew from having no dedicated players at the end of 2023 to more than sixty listed products by 2026, at a rate of fragmentation faster than that experienced by SEO in the 2000s.
Prices range from free to several hundred euros per month. Entry-level tools start at around $29 for about 15 tracked prompts; mid-range platforms cost around €90 to €150 per month; and enterprise solutions are priced on a quote basis. A French offering is also taking shape, alongside SEO suites, all of which have integrated an AI visibility module.
In this context, the fact that AEO Grader is free is a compelling argument. For a team that has never tracked anything, signing up for a subscription before even knowing whether the topic is strategically important to them is a classic mistake.
#3 The methodological limitation that no one should overlook
Let’s be clear about this, and it applies to the entire category:language models are not deterministic. Ask the same question twice, and you’ll get two different answers.
Research on visibility measurement in generative search is unequivocal on this point. A query run just once can yield a result that is significantly different from a second query run a few minutes later under identical conditions, meaning that a single observation may overestimate or underestimate a brand’s actual presence. The resulting methodological conclusion is that AI visibility should be understood as the probability of being mentioned—measured over repeated observations—rather than as a stable ranking.
What this means for you is very clear: an AEO Grader score is a compass, not a performance metric. It points the way and sheds light on a diagnosis. It is not intended to be included in monthly reports or to serve as a numerical target for a team.
What Really Makes a Difference
Improving AI visibility depends less on the tools used and more on the sources that the models consult.
Four key factors consistently emerge:
- Present concrete, data-driven evidence rather than promises.
- Maintain consistency between your website and your third-party profiles.
- Get coverage in reputable sources.
- Structure your content so that it can be easily reused in a template, with self-contained sections and direct answers.
Our Verdict on the AEO Grader
Run it if:
- You’ve never measured your visibility on AI search engines, and you want a starting point without committing any budget
- You want to map out how your competitors are perceived—which remains the most profitable use of this tool
- Are you looking to understand the narrative that AI systems are building around your category?
- You need to decide internally whether to invest in this area, and you need an initial set of indicators.
Don’t count on it if:
- If you’re looking for an indicator to track month after month, a one-time report isn’t the right choice
- You need data that holds up in executive committee meetings; the number of mentions is not a measure of audience reach.
- Your brand has changed significantly over the past eighteen months, and two of the three key players may not be aware of this
Should we switch to HubSpot AEO next?
It’s a valid question, because the Grader’s entire journey leads right to that point.
Our answer is nuanced.
The limitations we’ve just documented are precisely the ones that a continuous monitoring tool addresses. While the Grader generates its own standard queries, HubSpot AEO tracks up to 25 prompts of your choice—the ones your buyers actually use. Whereas the diagnostic is a one-time assessment, the tracking is weekly and allows you to measure a trend rather than a snapshot. Added to this is the ability to track 10 competitors and identify the sources that are actually cited. At €49 per month with no HubSpot subscription required, the pricing is aggressive in a market where comparable platforms often start at a higher price point.
The real differentiating factor, however, lies elsewhere and applies only to some readers: for users of HubSpot CRM and Marketing Hub, prompts are generated from actual CRM data, customer conversations, and saved segments, and recommendations integrate directly with content creation tools. You don’t have to export anything—you can take action right away. If you’re already using HubSpot, the seamless integration is hard to beat. If you’re not, feel free to compare it with specialized platforms on the market, some of which support more search engines.
HubSpot offers a free trial of HubSpot AEO—no HubSpot subscription required. This allows you to see for yourself whether ongoing monitoring truly provides more value than the Grader’s one-time assessment.
Our rating: 4/5. AEO Grader is the best free starting point for understanding what AI is saying about your brand—as long as you know what to look for. The narrative themes, the cited sources, and the cross-analysis of perceptions and exposure are well worth the email you requested. The numerical figures and market share data, however, should be interpreted as orders of magnitude rather than precise measurements, and the discrepancy between search engines is partly due to data sets collected at different times. Take it for what it is—a free, directional assessment—and you’ll get more value out of it than most teams that will simply settle for looking at the gauge.