


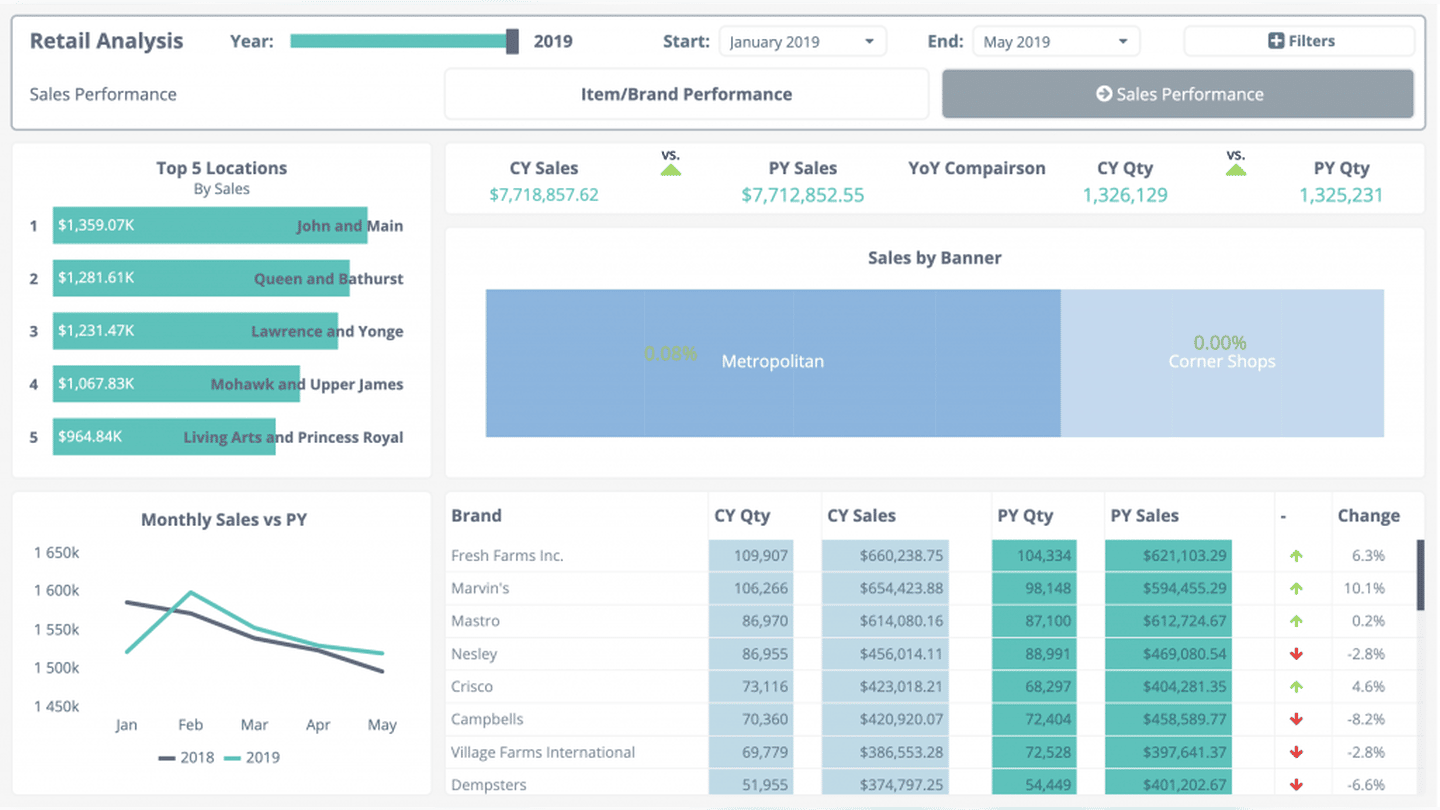
- Start from the audience and the goal (visual management, gamification, data access) before choosing a KPI.
- For leadership, a 360° view of the customer relationship; for the sales department, rep performance and the forecasts that make it possible to monitor the pipeline.
- Two or three views per dashboard, few colors, and every element must serve a purpose.
- A leaderboard built by team limits internal competition and encourages mutual support.
- The CRM often already offers complete dashboards, but users make poor use of them.
A sales dashboard serves several purposes:
- The first is what people usually mean by visual management. Everyone on the sales team (and even on other teams) gets a clear view of current performance and progress toward targets. That makes it far easier to align teams on company goals and to communicate very clearly about what is at stake.
- The second purpose sales directors mention most often is gamification. A leaderboard updated in real time throughout the day, ad hoc missions and targets, and so on. A sales dashboard is a strong way to communicate all of this and to keep a sales floor engaged.
- The last one has less to do with the dashboard itself than with access to the underlying data, through a data visualization tool advanced enough to support more complex analysis. The dashboard is the visible part of deeper work: exposing all of the company’s data.
Which KPIs should you choose for your sales dashboard?
The most important thing when choosing the right KPI for your needs is to think about the audience you are addressing and the goal you want to reach (visual management, gamification, data access). The choice of KPI will vary with the recipient’s role and reporting line. Depending on the KPI chosen, you can provide an operational or a strategic perspective.
For example, if the goal is a strategic perspective, the KPI should be chosen from indicators tied to customer satisfaction by product or sector, actual margin against forecast margin, or each product’s share of total revenue.
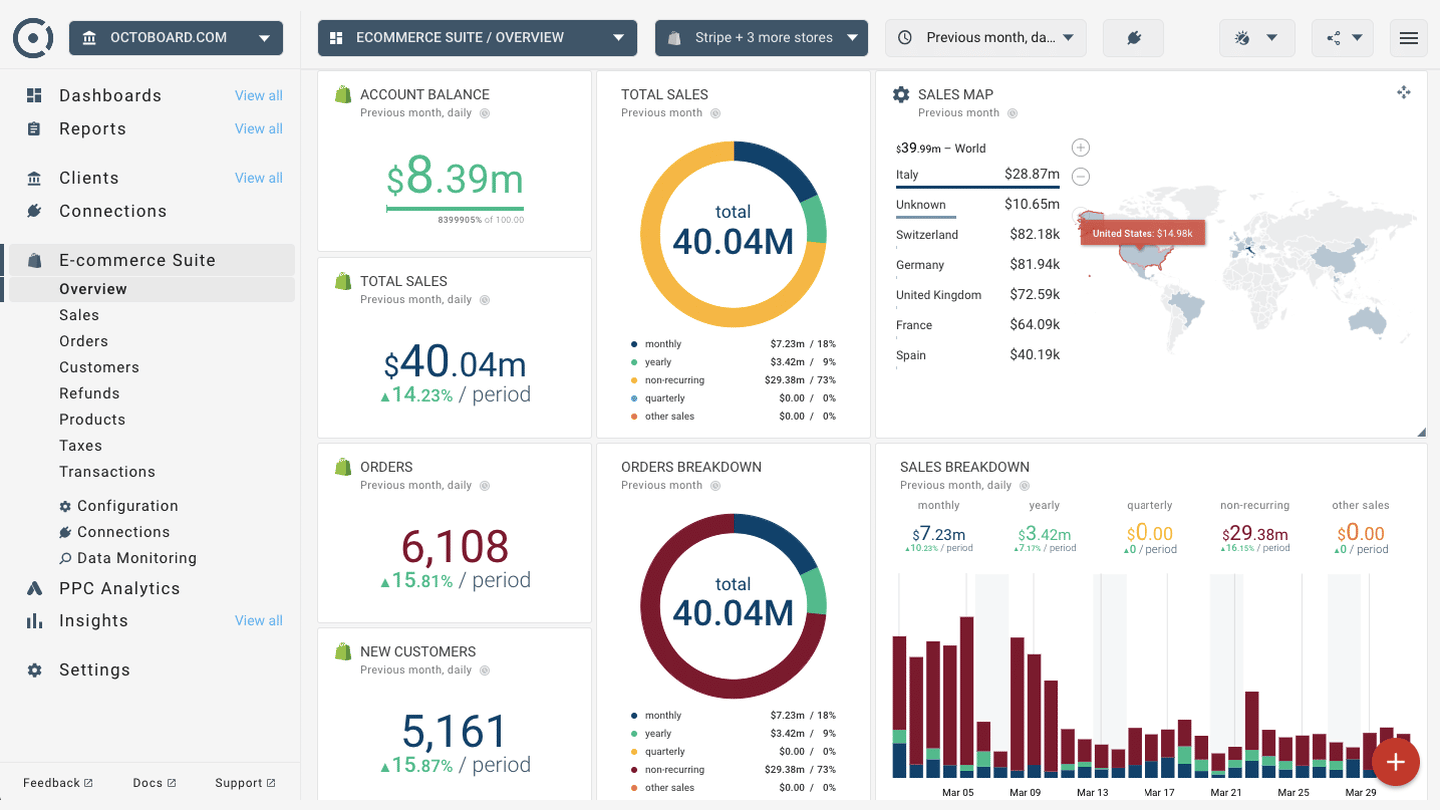
(Octoboard)
For a more operational approach and short- to medium-term goals, the choice can be based on the following criteria: conversion rate, repurchase and retention rates, revenue, loss and win rates, and so on.
In very concrete terms, C-level executives are best served by a KPI that gives them a 360° view of everything related to customer relationships, without going down to a fine level of detail. For a sales department, the goal is rather to track employee performance and precise sales forecasts in order to monitor the sales pipeline and prioritize the most relevant opportunities.
How do you build a successful sales dashboard?
The best way to design a dashboard is to keep in mind who it is for. You also need to take their level of expertise into account and calibrate the topics and data accordingly. Beginners will obviously have different needs from more experienced users.
For better overall readability, limit yourself to two or three views. If you want to widen the scope, it is better to create other dashboards or use a story, meaning a sequence of visualizations that work together to guide the user through the information. Also keep the number of colors low to avoid a visual overload that prevents users from analyzing the data correctly.
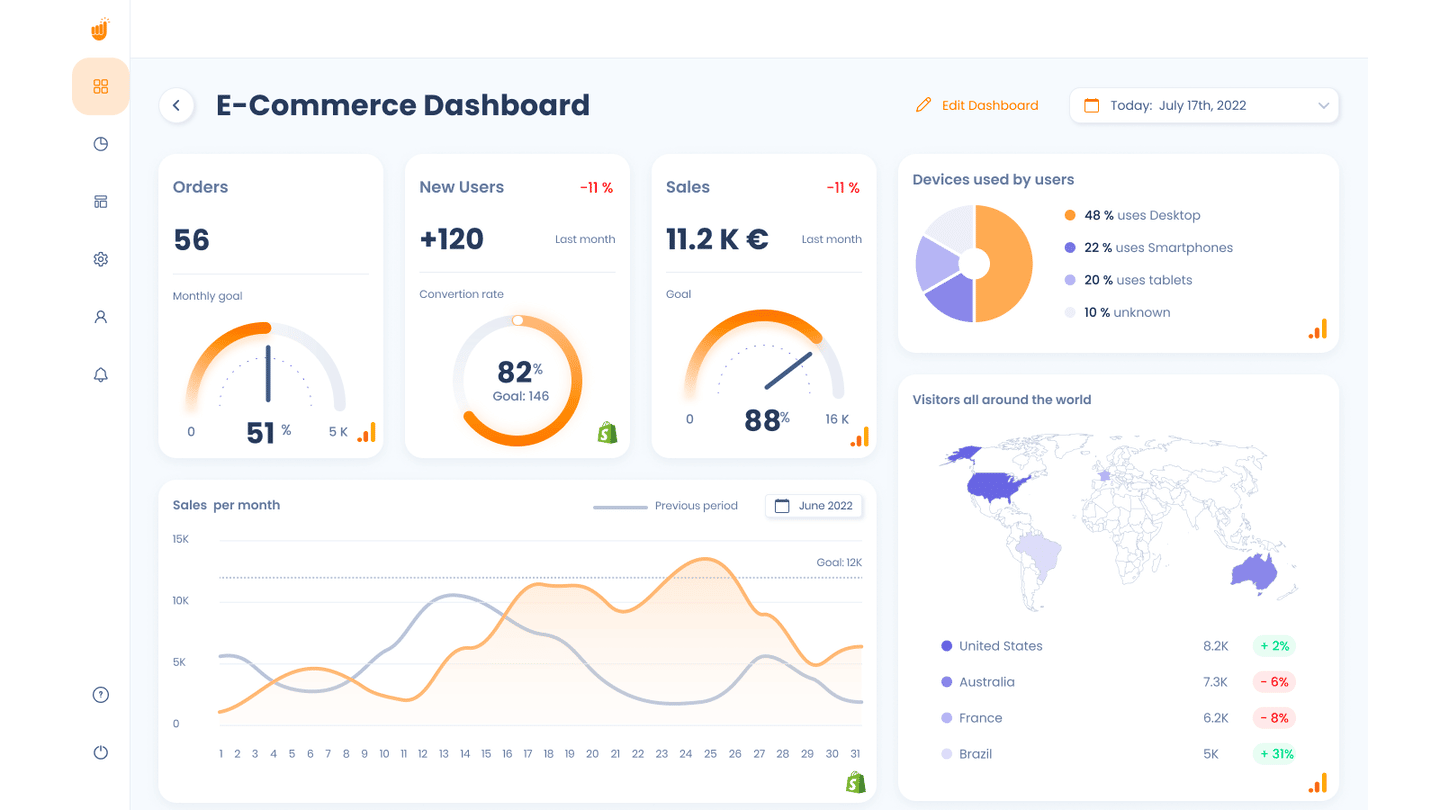
(Vizpoint)
Once the initial design work is done, turn to tooltips. They are an excellent opportunity to reinforce the story you are trying to tell with your dashboard. You can easily customize them to fit your goals.
In short, every element of your dashboard must serve a purpose. If you feel it is too cluttered, don’t hesitate to remove elements, adopt a new layout or switch to a floating layout. That lets you give your dashboard a specific fixed size even if the window size changes.
5 sales dashboard examples
1. The management dashboard
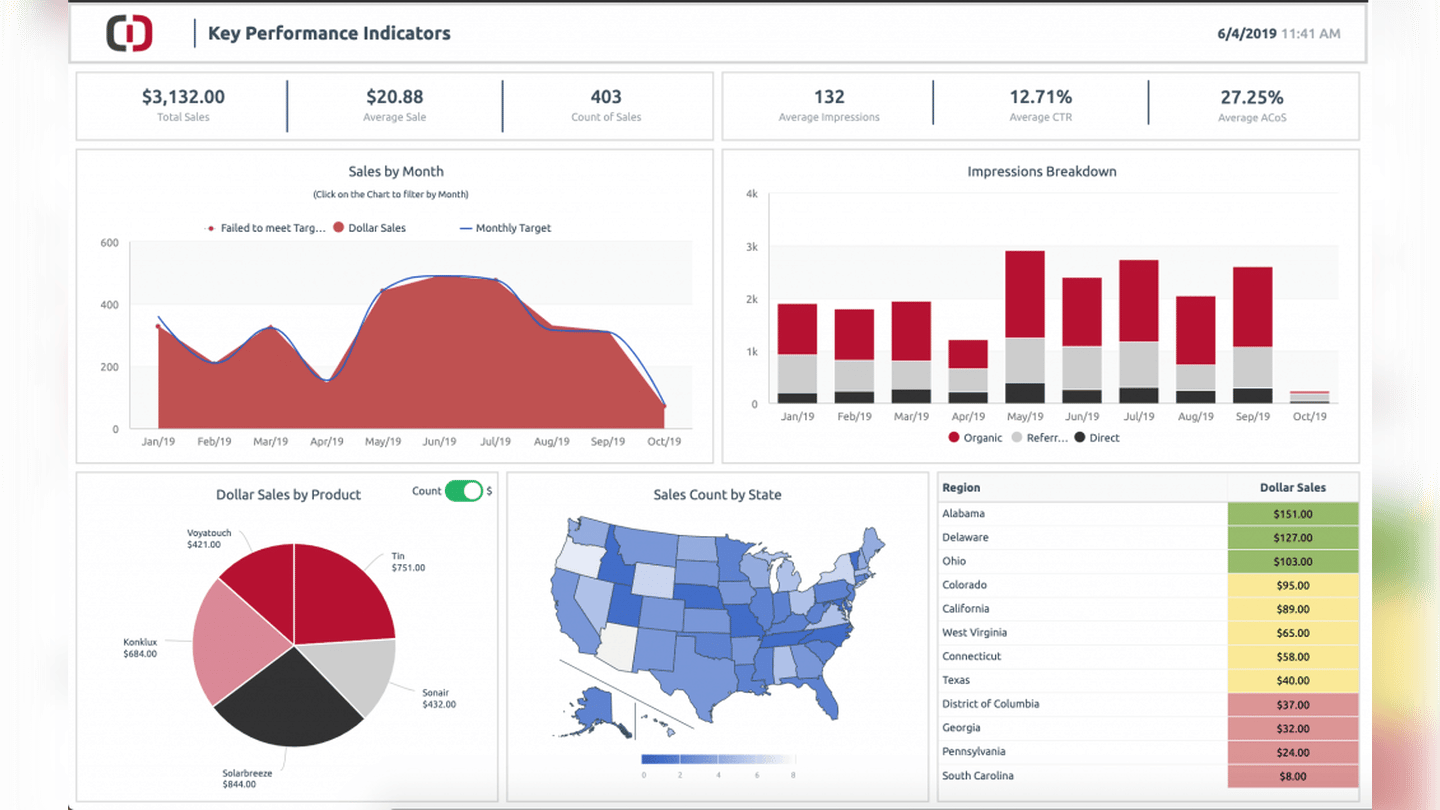
(Clicdata)
A sales dashboard can take the form of a management dashboard offering profitability and revenue reports. It provides key information on sales performance. It clearly identifies the areas where you need to focus your sales and marketing efforts.
2. The sales activity tracking dashboard
(Databox)
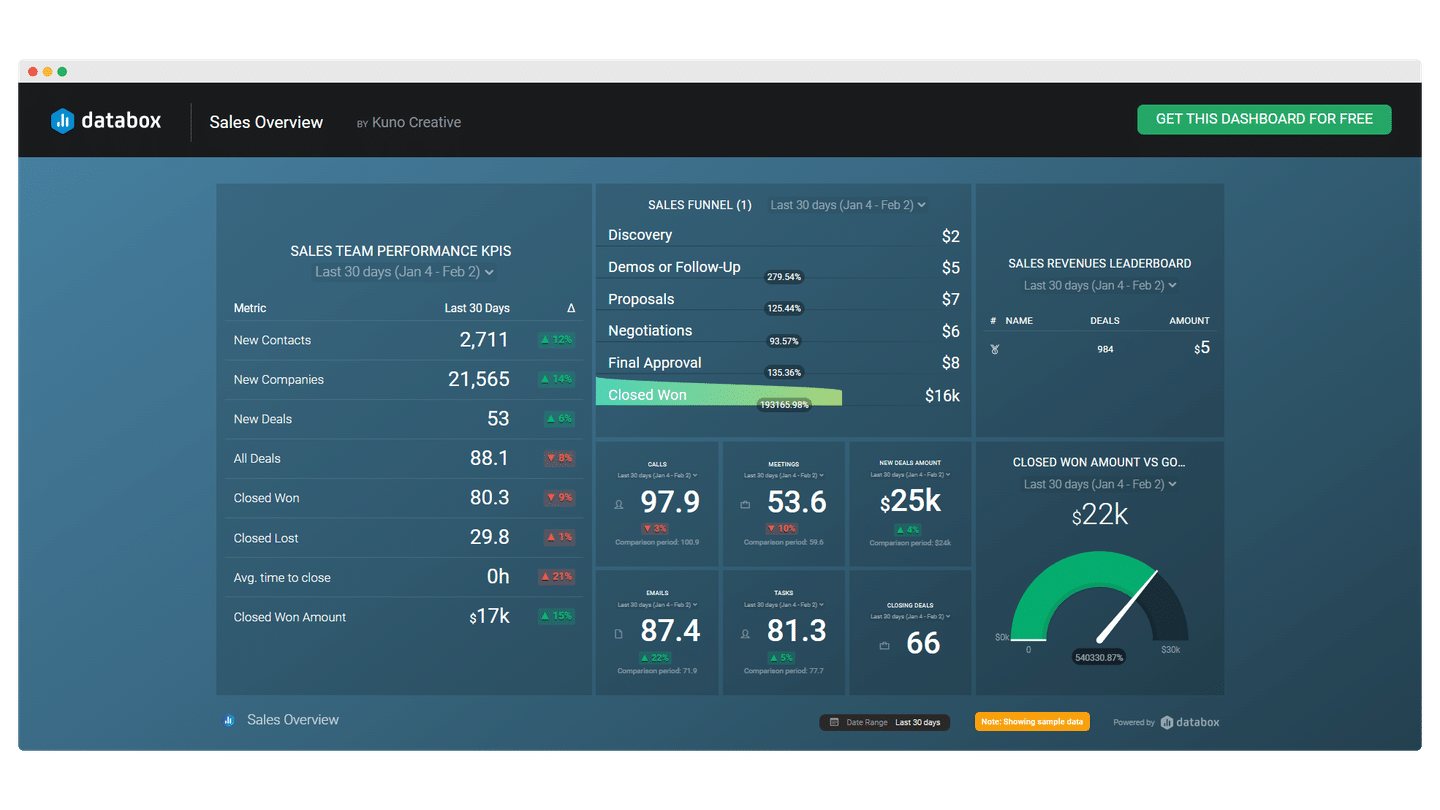
The sales activity tracking dashboard lets you log tasks: calls to make, number of emails to send or leads to contact, and so on.
This dashboard sits much closer to operational teams. It tracks sales activity very closely so the team can react quickly if the funnel stops moving as it should.
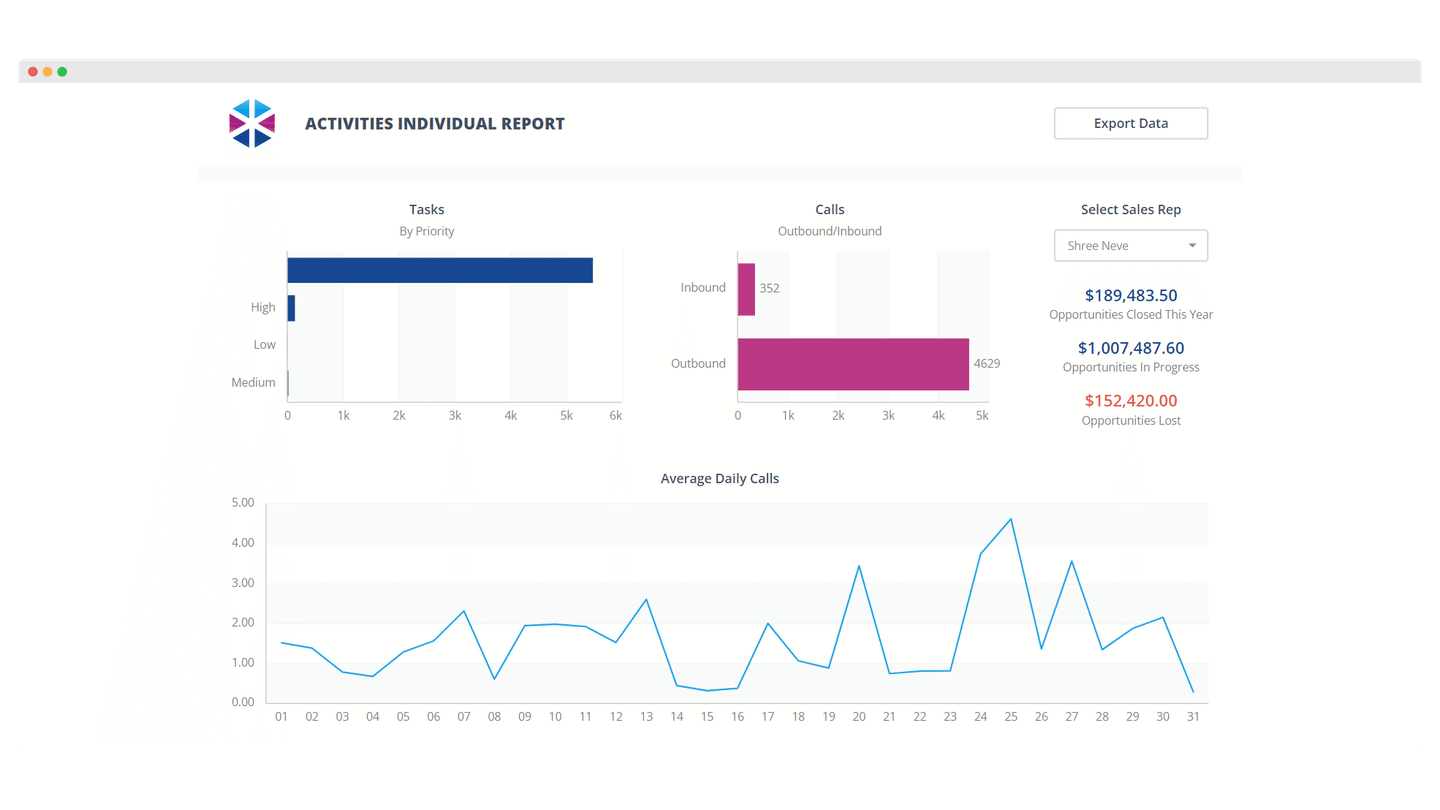
This dashboard is often split into several individual reports. That makes it possible to track each team member’s individual sales activity.
(Clicdata)
3. The leaderboard: a driver of motivation and gamification
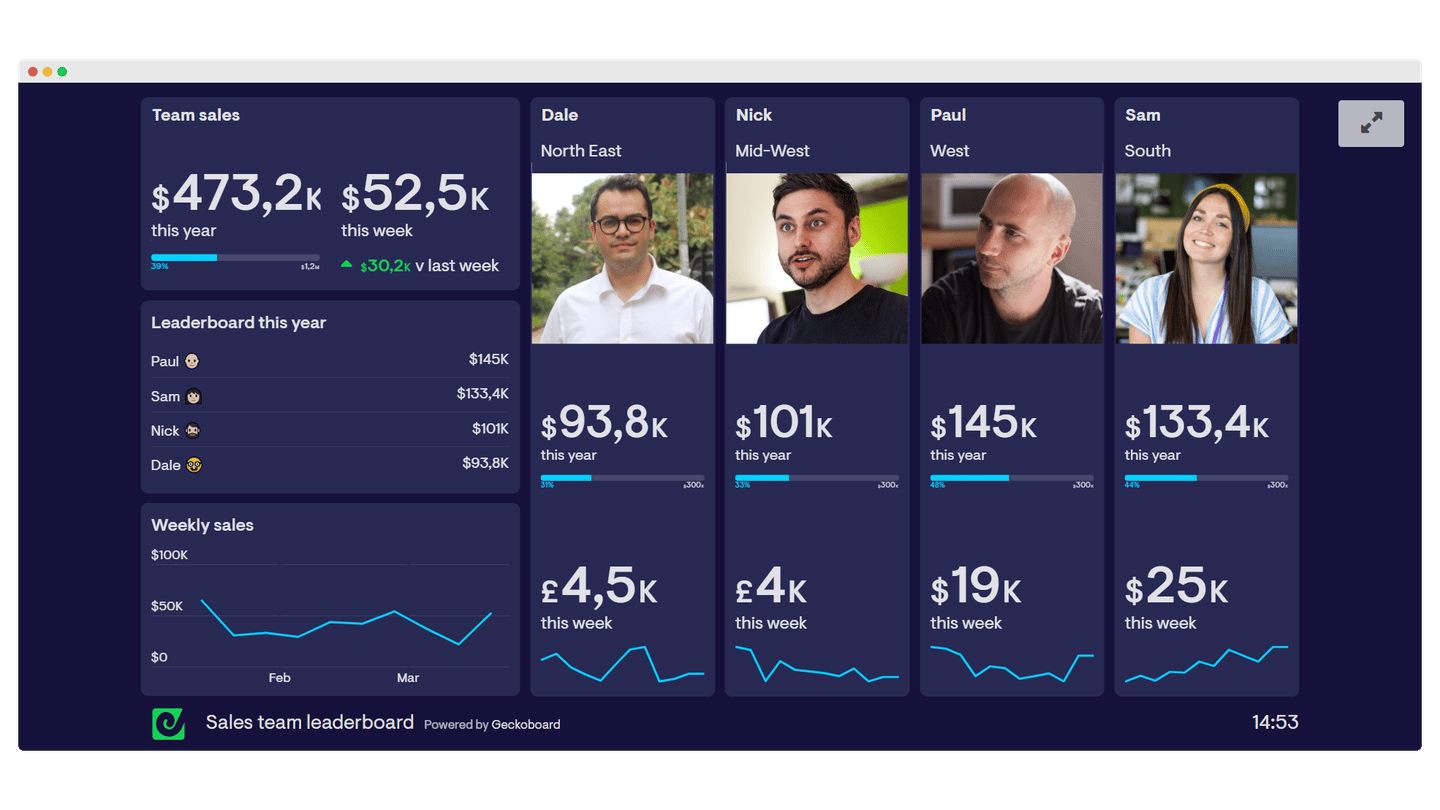
The leaderboard gives a real-time update on every contest you run within a sales team. It is an excellent way to motivate your team and let everyone know what they need to do.
The leaderboard can also be built by team, to avoid excessive internal competition and encourage mutual support, particularly if you are hiring a lot.
4. The forecast dashboard
(Databox)
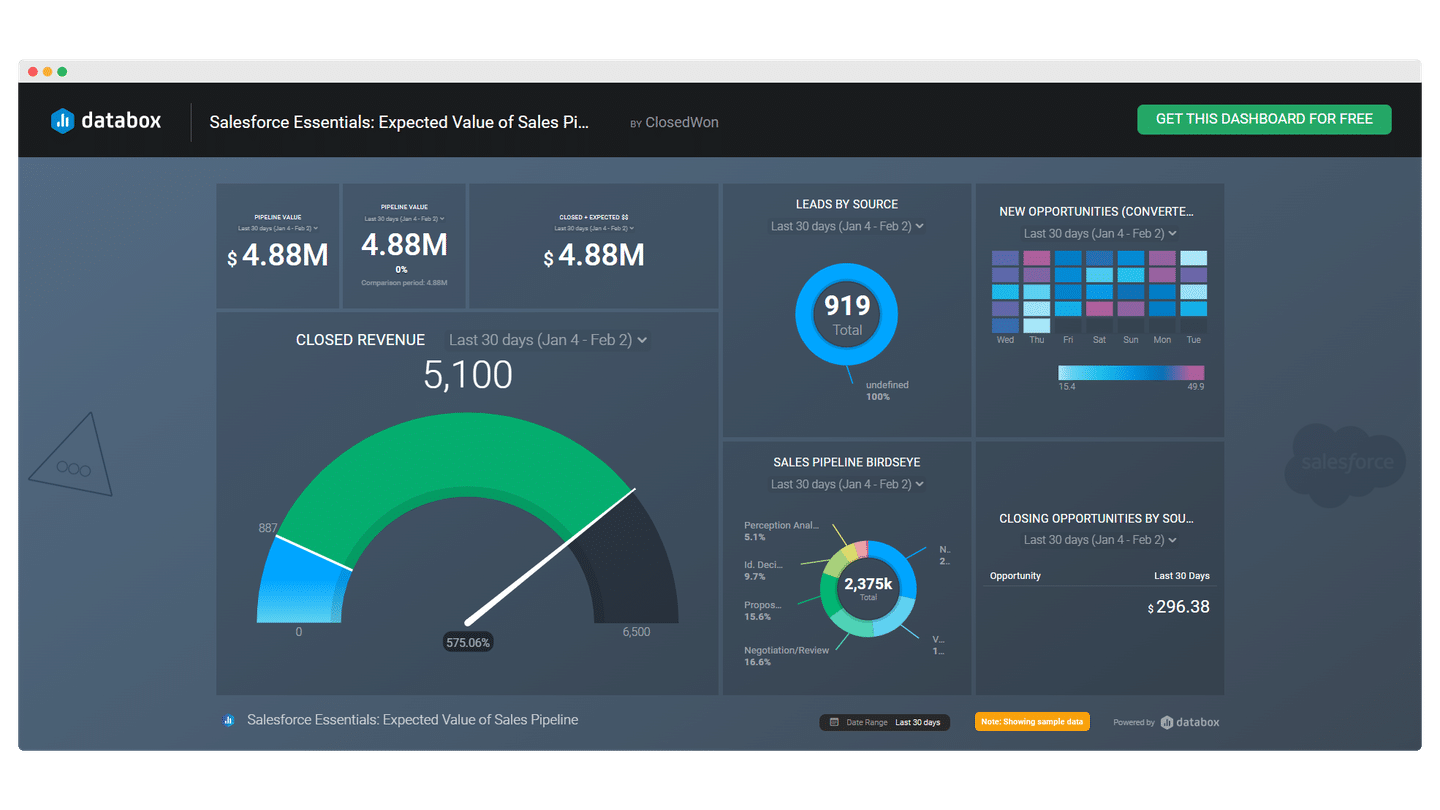
The goal of the forecast dashboard is to show the state of the sales pipeline.
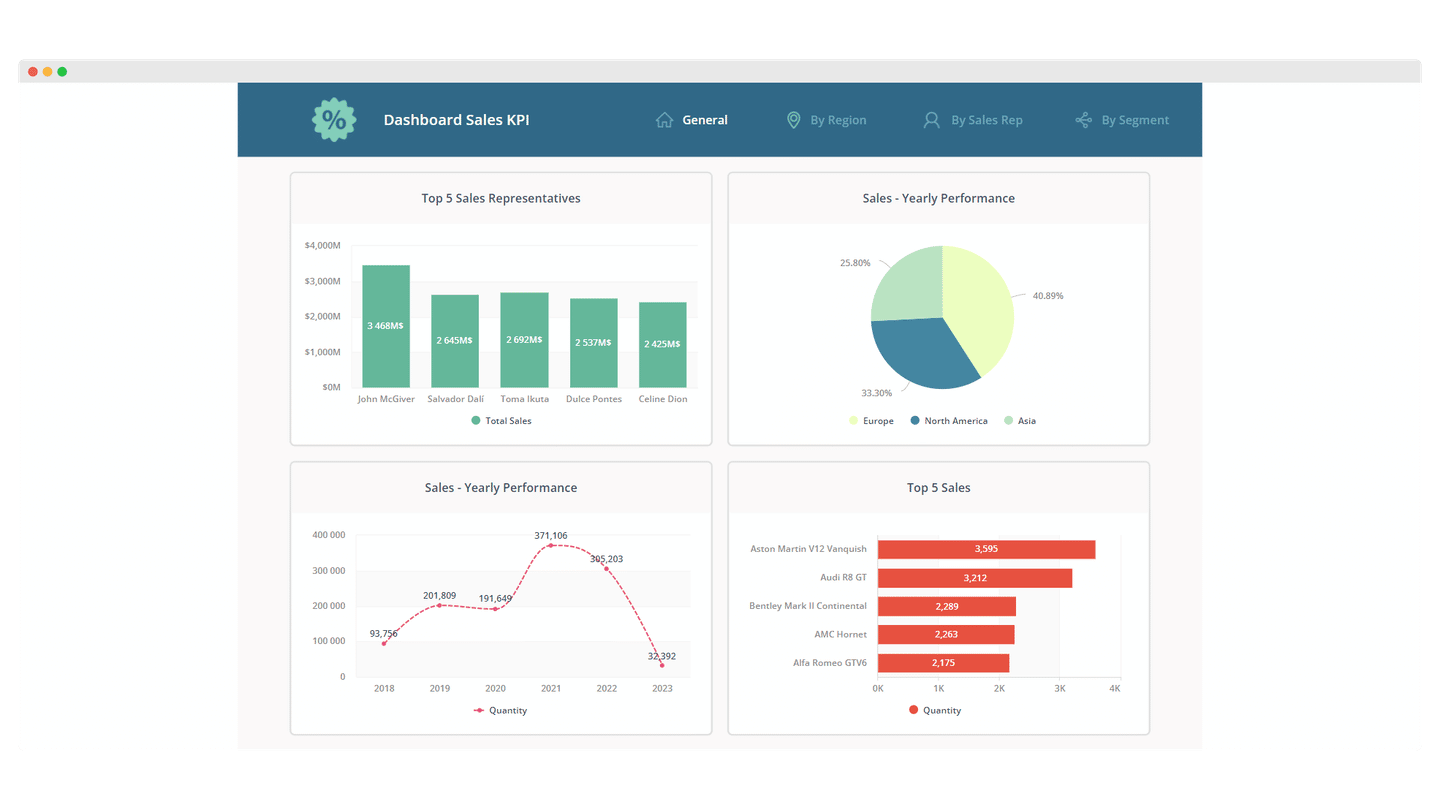
(Clicdata)
5. The marketing ROI dashboard
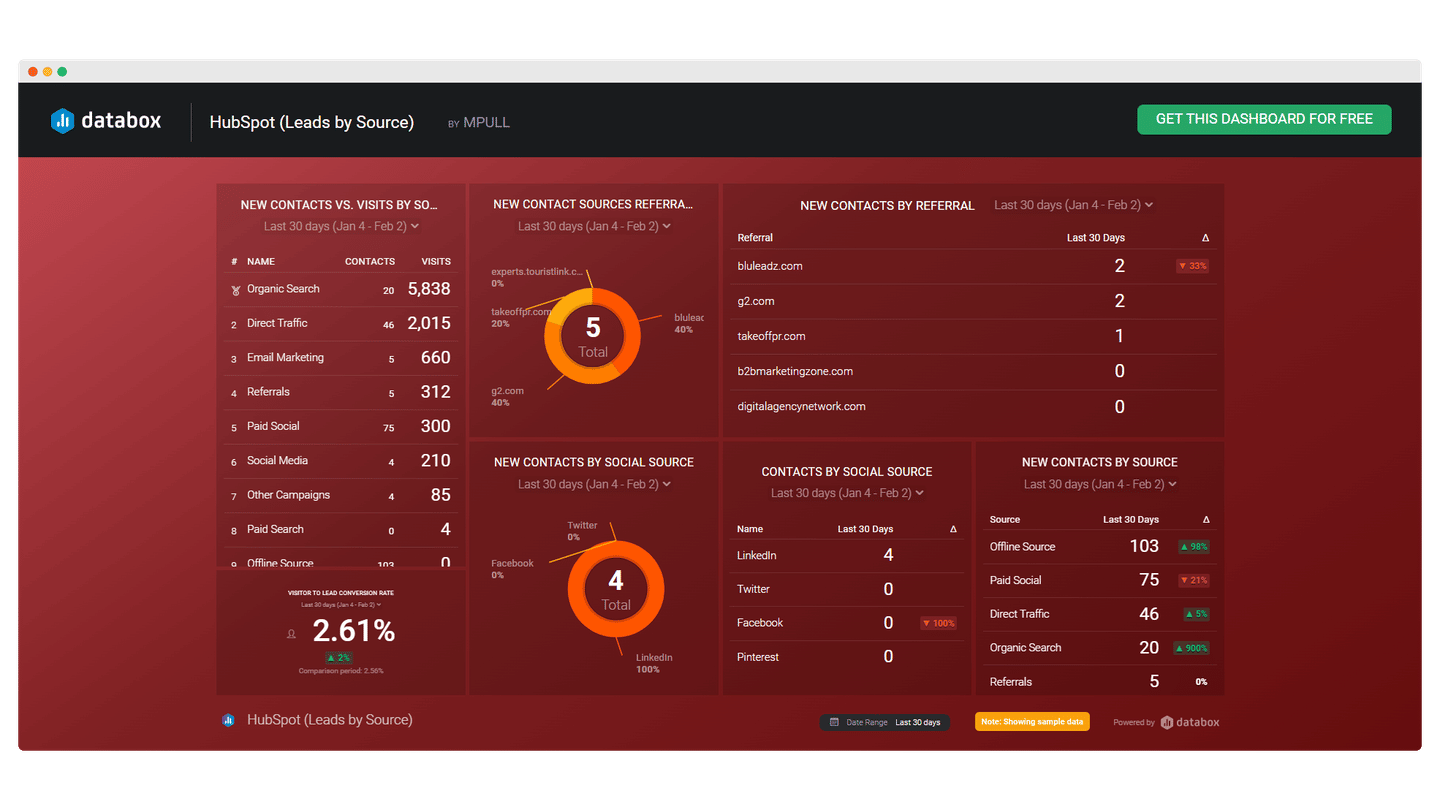
(Databox)
The main challenge with this last dashboard is above all to better align sales & marketing teams. Here again, setting shared KPIs on a visible, accessible dashboard really moves things forward.
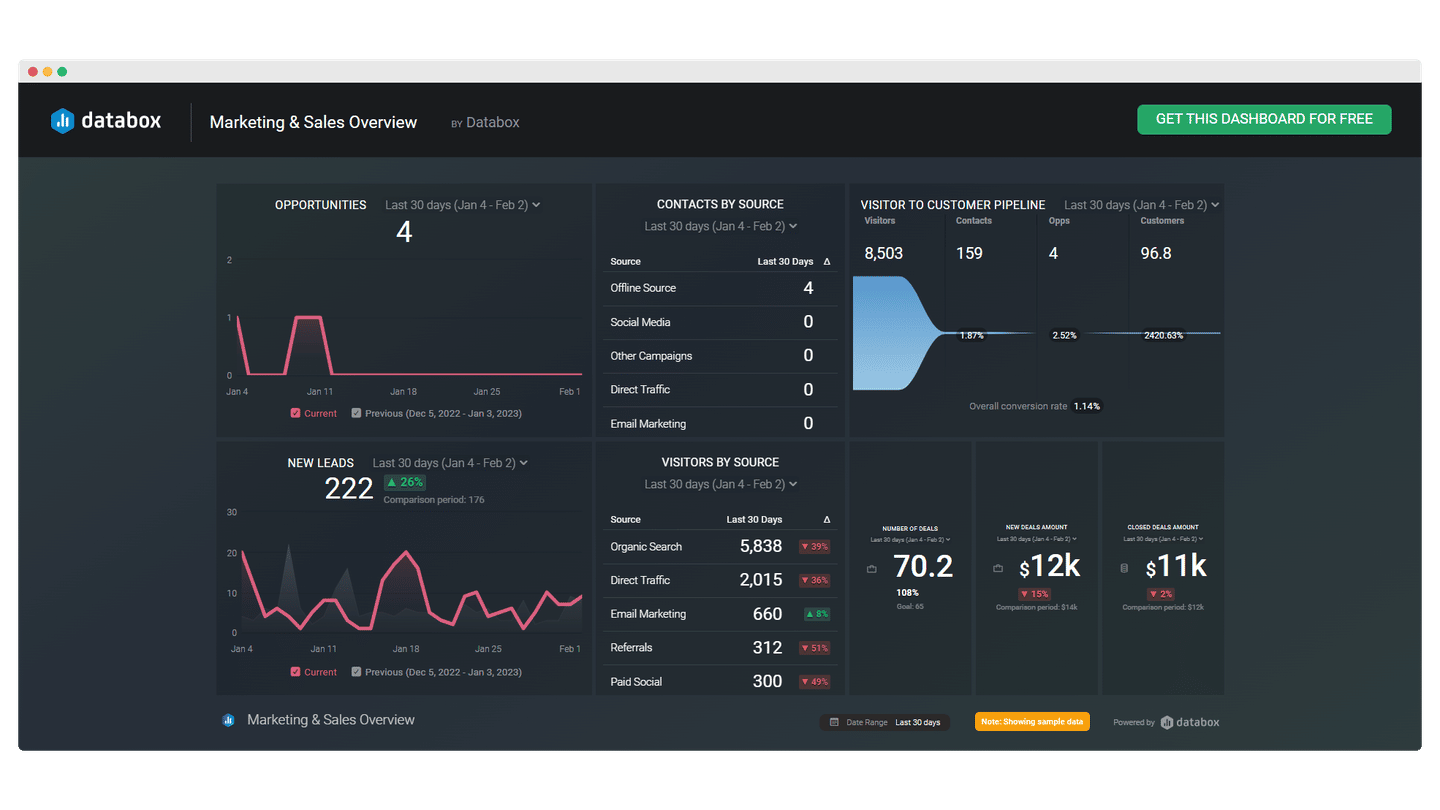
(Databox)
Which tools can you use to build a sales dashboard?
1. Your CRM software
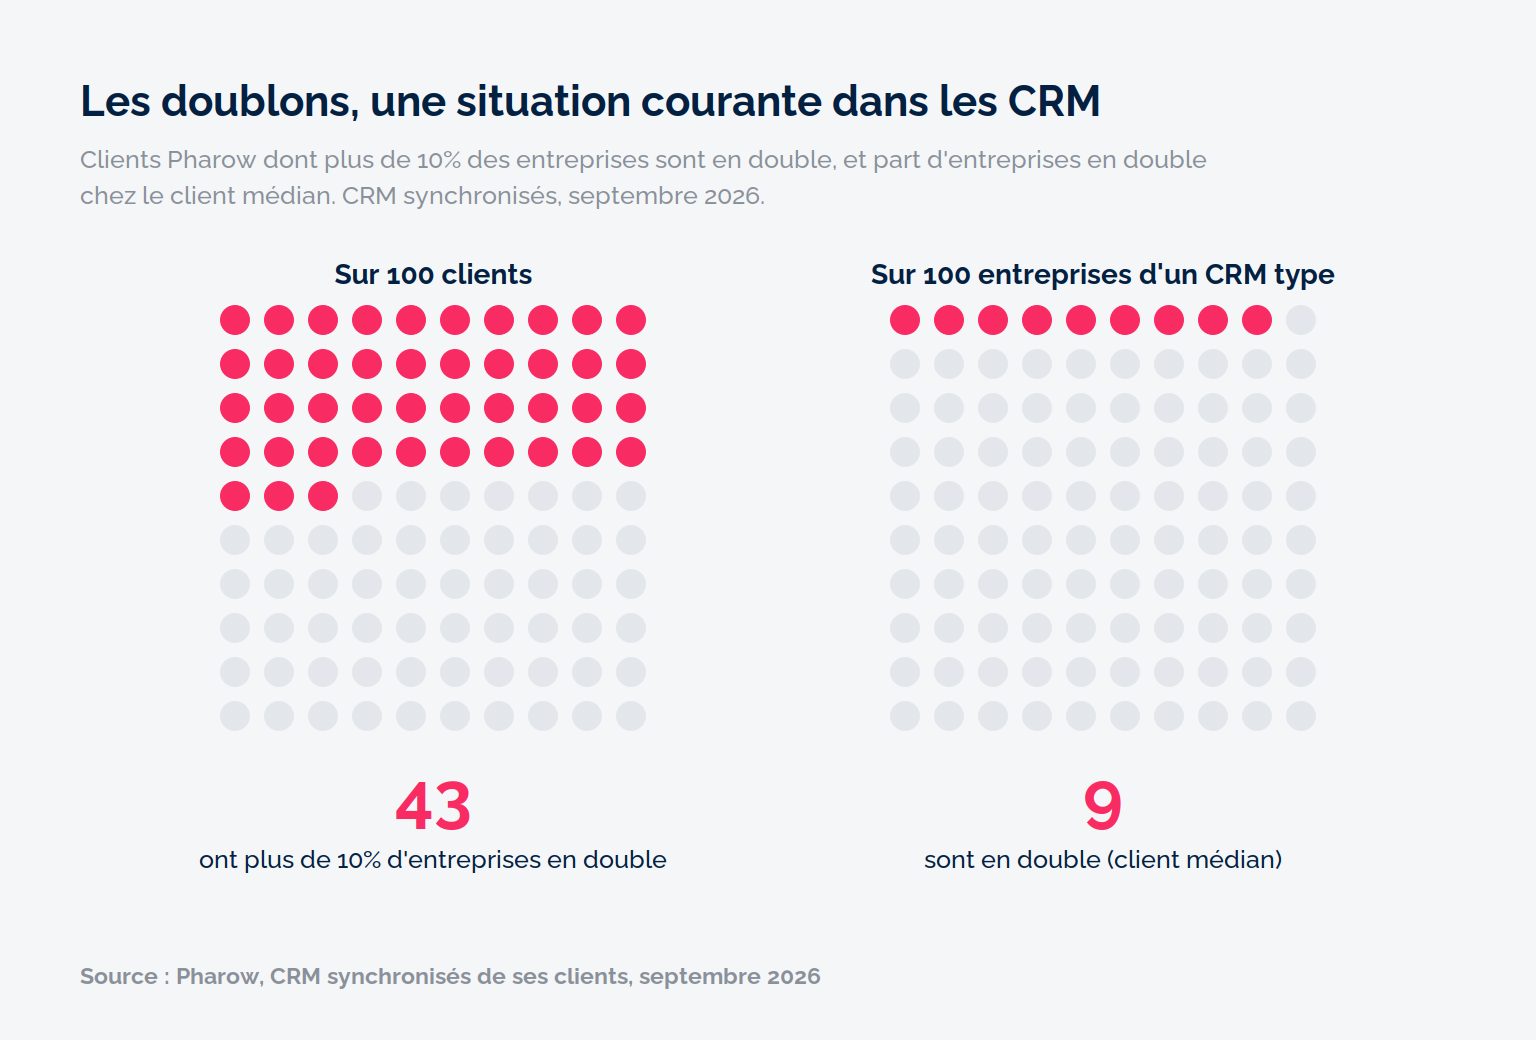
CRM software offers very useful dashboarding features for building your dashboard. Most tools give you access to the timeline of your customers’ activity, which makes it easy to manage your sales and your customer interactions. Sales reports let you track figures such as new contracts or recurring revenue. In most cases, these are very complete solutions but rather poorly used by their users.
2. Geckoboard
Geckoboard is an interactive data analysis and dashboard creation tool that is very easy to pick up. It helps companies collect and visualize their key sales performance indicators through real-time sales dashboards.
The software can use data from more than 90 data sources and bring in data through spreadsheets, Zapier or custom APIs. It also has a drag-and-drop editor to quickly customize your dashboard and add the widgets you want.
Geckoboard offers a 14-day free trial so you can get a good idea of what the tool can do.
3. Databox
Databox is an easy-to-use dashboard creation tool that simplifies your sales processes. It brings all your sales data together in one place and lets you monitor and present the data through your dashboards, all in real time.
Databox offers more than 130 integrations and hundreds of predefined dashboard templates to quickly collect and visualize your data. You can easily customize them with the built-in drag-and-drop dashboard designer.
The software can also send notifications in Slack when a key performance indicator rises or falls past a certain threshold.
Databox offers a free plan and a 14-day trial of its paid plans so you can get a good idea of what the tool can do.
4. Klipfolio
Klipfolio is software for creating dashboards and centralizing your data without a developer. It adapts to every industry, but it is particularly popular with medium and large companies that have a dedicated sales department and specific needs.
Klipfolio offers more than 130 integrations and also pulls data from your Excel or Google Sheets files. You work with formulas, as in a spreadsheet. Klipfolio provides around thirty predefined chart types to visualize your data and lets you customize your dashboard quickly.
Klipfolio offers a 14-day free trial, with nearly full access to Klips, so you can get a good idea of what the tool can do.
5. Scoro
Scoro is professional services management software: projects, resources and finances in one place, with a CRM and sales pipeline management module. It gives a real-time overview of your projects and your performance, so you can make data-based decisions.
Scoro also shows which customers, projects, services or teams are profitable, and which ones weigh on your margins.
With its reporting features, you can track performance and key performance indicators and identify difficulties and opportunities through real-time information.
Scoro offers a 14-day free trial so you can get a good idea of what the tool can do.
6. Looker
Looker is Google Cloud’s BI and analytics software. It helps companies collect, monitor and visualize sales information in real time through interactive dashboards. It is very easy to use and perfectly suited to anyone looking for a simple but complete solution.
Looker makes it easy to integrate data from databases such as BigQuery, Snowflake and several dozen other SQL dialects. Looker’s mobile app gives instant access to dashboards and lets you monitor key performance indicators.
7. Qlik Cloud Analytics (Qlik Sense)
Qlik Cloud Analytics, the cloud offering that succeeded Qlik Sense, is an advanced business and sales analytics tool that helps companies drive productivity, increase revenue and reduce risk more effectively.
It also automates report creation and sharing with key team members.
Qlik offers a full, free 30-day trial version so you can get a good idea of what the tool can do.
8. Google Data Studio
Google Data Studio (for a time renamed Looker Studio) is a visualization tool for creating interactive dashboards and great-looking custom reports. It connects directly to more than 1,400 data sources, including Google Sheets, Google Ads, BigQuery and Google Analytics. It is widely used by marketing teams and agencies. If you want to cross-reference marketing and sales data, Google Data Studio is a worthwhile option.
You can work on the same dashboard with your sales team in real time. Google Data Studio also lets you embed your dashboards in various media (emails, blogs, etc.).
Google Data Studio is also useful for transforming your data. With calculated fields, you can create new measures based on formulas, and apply arithmetic or comparison operators or other more sophisticated functions.
Google Data Studio is free, for report creators and readers alike. A paid version, Data Studio Pro, adds support and administration features for teams.
The questions we get over and over.
Which KPIs should you choose for a sales dashboard?
It all depends on the audience and the goal. For a strategic perspective: customer satisfaction by product or sector, actual margin against forecast margin, each product’s share of revenue. For an operational approach: conversion rate, repurchase and retention rates, revenue, loss and win rates.
How many views should a sales dashboard have?
Two or three to stay readable. To widen the scope, it is better to create other dashboards or a story, meaning a sequence of visualizations that guide the user.
What is a sales leaderboard for?
It shows in real time the state of the contests running within the sales team. It is a way to motivate the team and let everyone know what they need to do. Built by team, it avoids excessive internal competition.
Which tools can you use to build a sales dashboard?
The CRM first, whose dashboarding features are often underused. Then dedicated tools such as Geckoboard, Databox, Klipfolio or Scoro, BI tools such as Looker and Qlik, and Google Data Studio, which is free.


What the community says.