



- Use AARRR as a diagnostic tool: look for the weakest stage and focus your efforts there, whatever its place in the acronym.
- No acquisition strategy can make up for failing retention: scaling acquisition first means filling a leaky bucket.
- The RARRA variant puts retention first, for product-led models where acquisition is expensive.
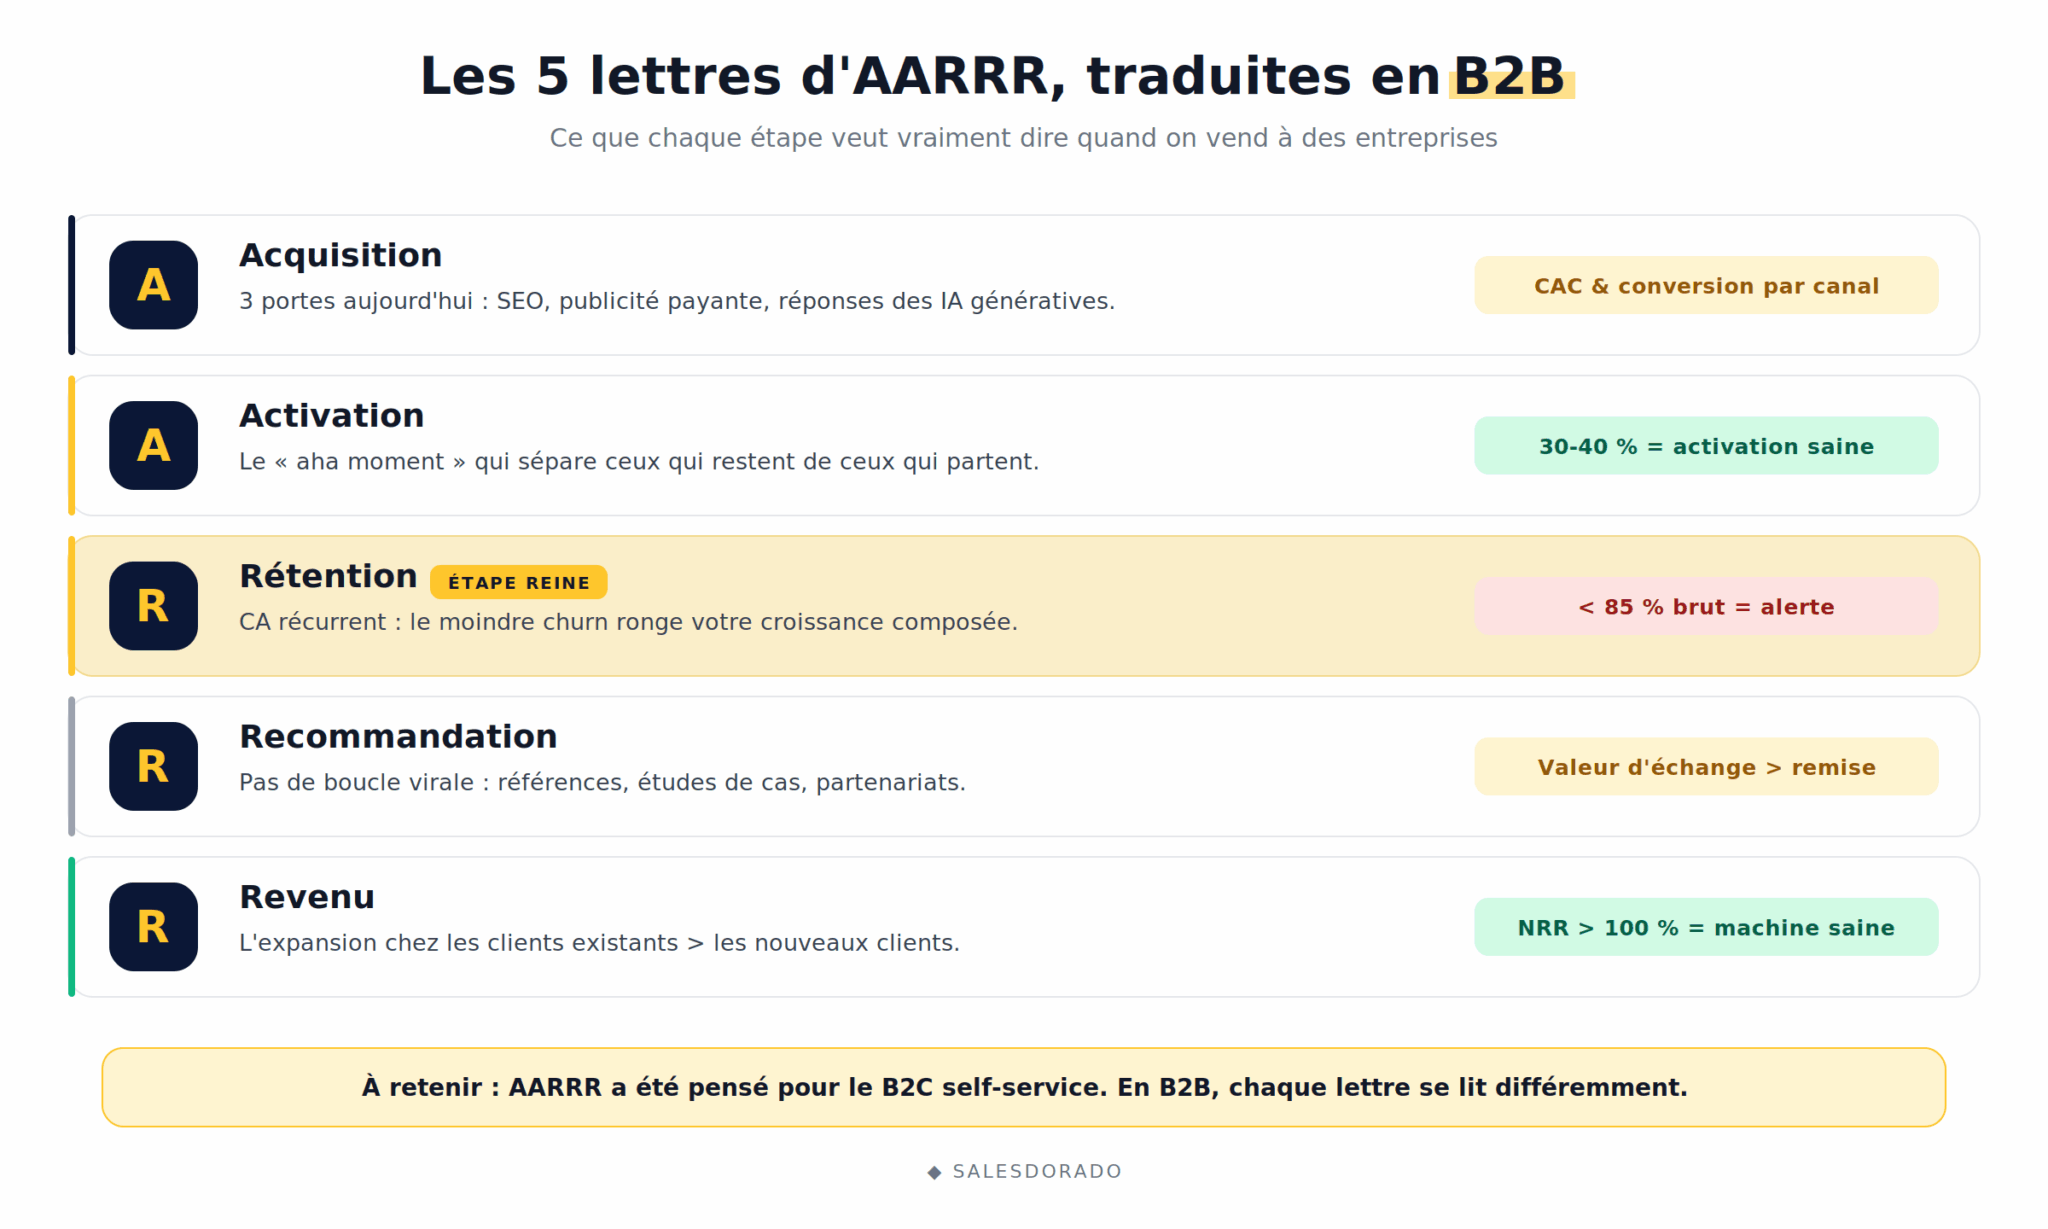
- In B2B, activation is often measured at the team level, and referral goes through customer references, case studies and partnerships.
- Net revenue retention (NRR) above 100% signals a healthy machine.
If you’re looking for an article on the AARRR framework, you’ve probably already come across a dozen versions of the same text: the famous pirate cry, the five letters defined one after the other, the three usual examples (Dropbox, Facebook, Airbnb) and a list of analytics tools to install. You close the page knowing what AARRR stands for but still not what to do with it on Monday morning.
At Salesdorado, we have a pretty firm opinion on this famous AARRR framework. The problem, to be honest, lies in the acronym itself. Read it in order often enough and you end up believing you have to work through its five stages in that order, starting with Acquisition. It’s the most expensive mistake you can make with this model, especially when you sell B2B.
What you’ll find in this article:
- Which stage of the AARRR framework to start with, depending on your growth model.
- What each letter concretely means in B2B reality (because AARRR was originally designed for consumer apps).
- Real figures from companies that actually applied it.
AARRR: the bare minimum before busting the myth
The AARRR framework was introduced in 2007 by Dave McClure, investor and founder of the 500 Startups accelerator, in a presentation that became famous under the name “Startup Metrics for Pirates”. The name comes from the sound of the acronym, close to a cartoon pirate’s cry. That’s it for the anecdote, it ends there.

The underlying idea is far more interesting. At the time, founders were drowning in dashboards full of “vanity metrics”, visit and follower counters that were flattering but said nothing about the real health of a company.
McClure proposed boiling everything down to five questions that actually matter.
- Acquisition: where do your prospects come from?
- Activation: do they have a successful first experience?
- Retention: do they come back, and how often?
- Referral: do they talk about you to the people around them?
- Revenue: how much do they bring in, and at what cost?
The most accurate way to picture the model is a leaky bucket. Your prospects come in at the top through acquisition. At each stage, some of them escape. No funnel converts at 100%, that’s normal. The whole point of AARRR is to spot where your biggest leaks are.
The acronym trap: why nobody should start with Acquisition
Here’s the point most guides forget to mention.
The order of the letters describes your customer’s journey. It does not describe the order in which you should tackle your projects.
The nuance looks subtle, but it actually changes everything. Imagine for a moment that your retention is poor: your customers sign, then drop off after three months. If your reflex is to invest more in acquisition to compensate, you’re just filling a leaking bucket faster. You acquire a hundred customers, sixty leave within the quarter and your acquisition cost becomes impossible to pay back.
The numbers are stubborn on this point. Acquiring a new customer costs several times more than keeping one. According to Frederick Reichheld’s work at Bain, cited in the Harvard Business Review, a 5% increase in retention rate can increase profits by 25 to 95%.
Moral of the story: no acquisition strategy can make up for failing retention.
So the right way to use AARRR is not to run through the five stages in sequence, but rather to make a diagnosis: which stage is dragging everything else down? A single underperforming stage is enough to bring down the yield of the whole funnel. That’s where (and nowhere else) you should focus your efforts.
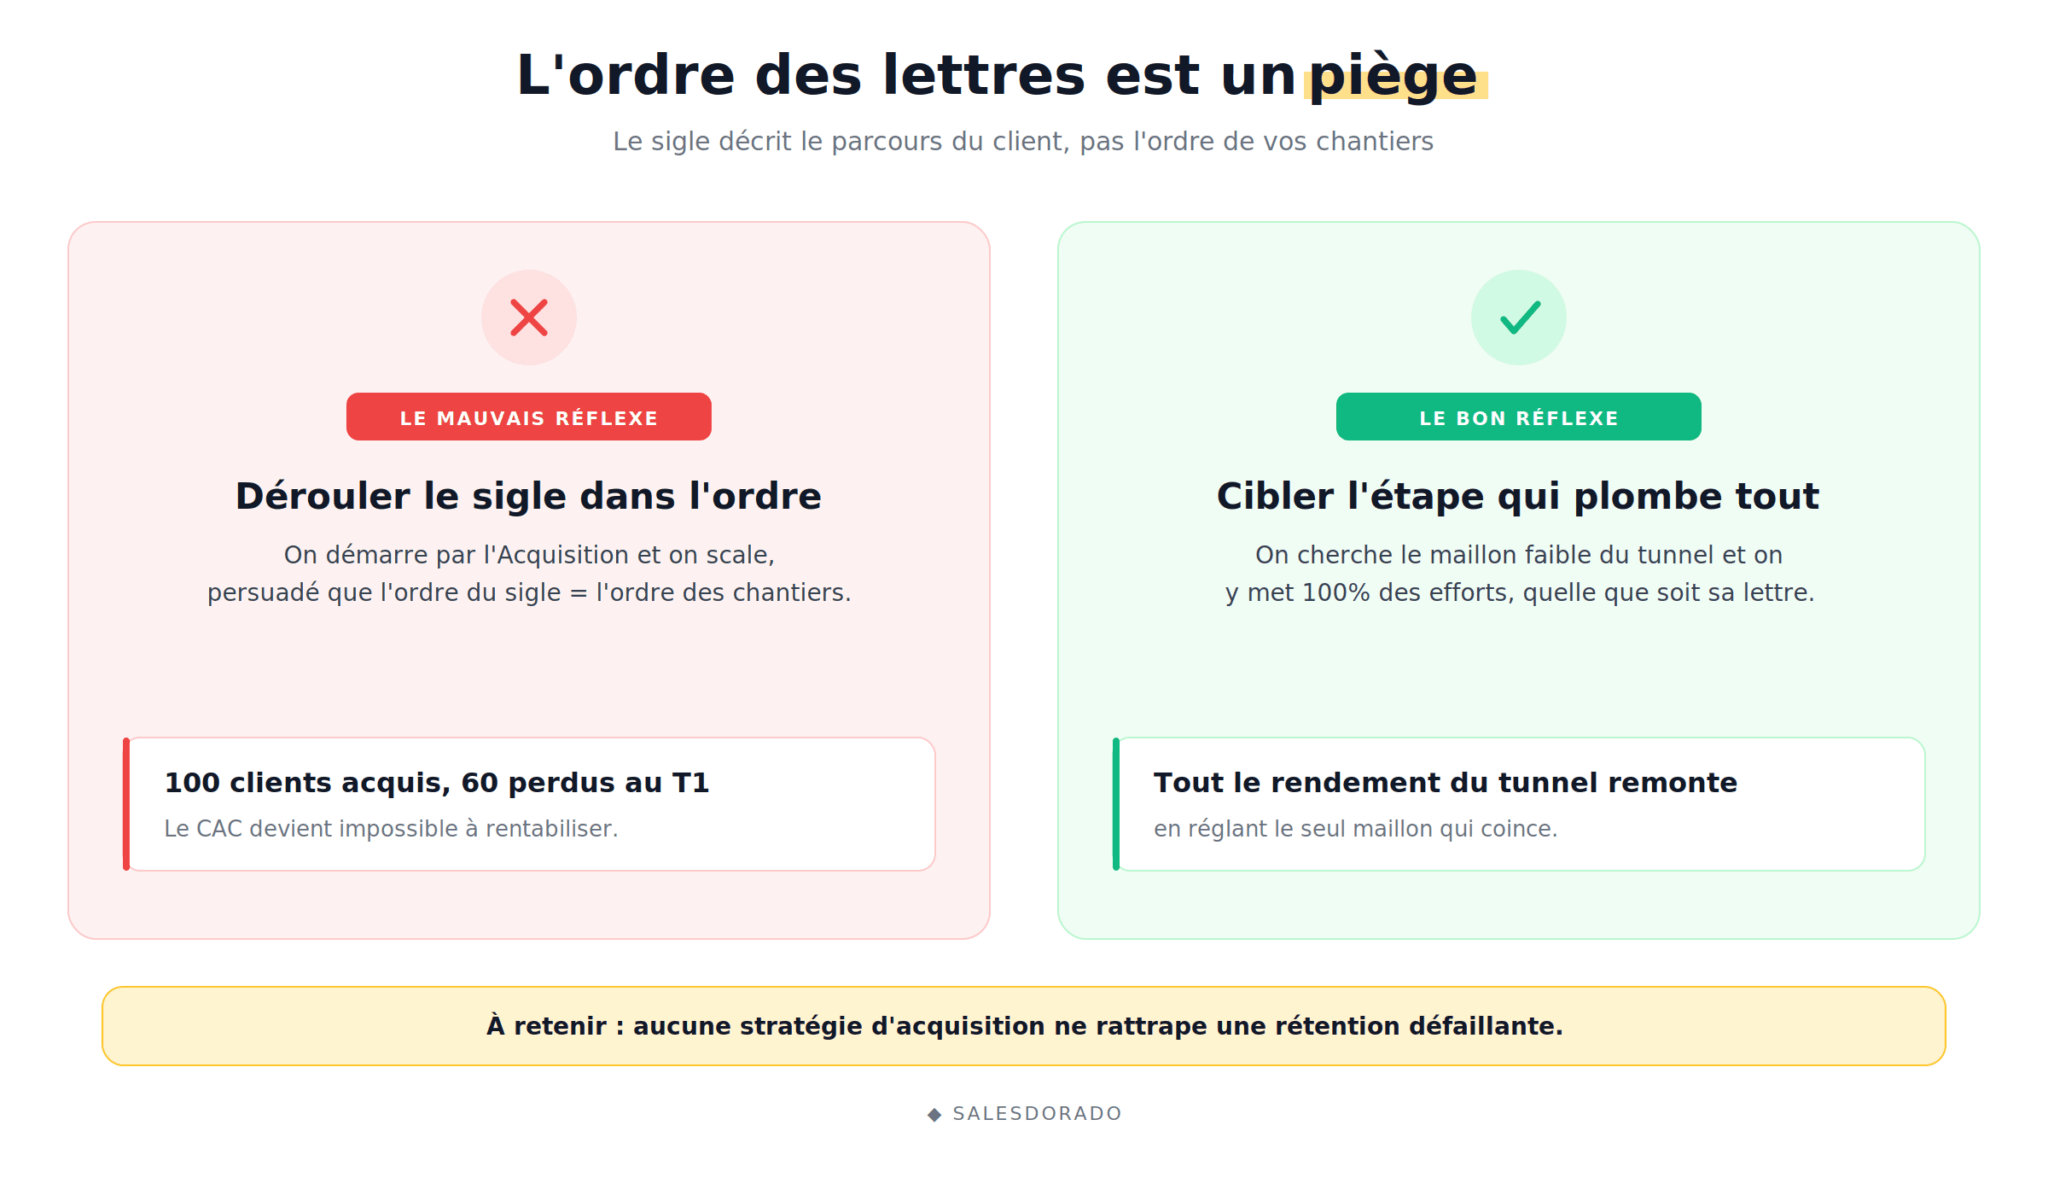
The classic mistakeScaling acquisition before fixing retention. Every new customer will enter the funnel at the same leak rate as the ones before. You spend more for an identical net result, sometimes worse.
RARRA, the version that puts retention first
This observation gave rise to a variant: RARRA. The same stages, but in a different order of priority: Retention, Activation, Referral, Revenue, Acquisition. The model was popularized around 2017 by growth experts Thomas Petit and Gabor Papp, in response to a market where acquisition channels are saturated and the cost per lead keeps rising.
The logic of RARRA fits in one sentence: most SaaS companies don’t die from a lack of customers, but from their inability to keep them. Since retaining costs far less than acquiring, you might as well make retention your compass and build everything else around it.
So, which letter should you start with?
There’s no single answer, and that’s precisely the whole point of using the framework as a diagnostic tool rather than as a recipe.
Here’s how to decide depending on your situation:
- You haven’t found your product-market fit yet? Start with Activation. Identify what makes your users want to stay, then build your acquisition around that signal.
- Your retention is weak, below roughly 85% gross retention? Fix it before spending one more cent on acquisition.
- Your retention is solid, at 90% or more? Then you can push acquisition hard: your customer lifetime value to acquisition cost ratio will hold up.
- Your growth is driven by the product or by marketing? The RARRA logic will speak to you more, since it’s usage and referral that keep the machine running.
- Your growth is driven by a sales team (sales-led)? Stick with AARRR, but read retention as revenue expansion in your existing accounts.
| Criterion | AARRR | RARRA |
|---|---|---|
| Order of priority | Acquisition first, revenue at the end of the chain | Retention first, acquisition last |
| Key stage | None in particular. The model is used to find the bottleneck | Retention, seen as the engine of everything else |
| Ideal profile | Sales-led, validation phase, growth to structure | Product-led, saturated market, high acquisition cost |
| Central question | How do I acquire profitable customers? | How do I keep the ones I already have? |
| Main risk | Filling a leaky bucket | Underinvesting in acquisition once retention is fixed |
Acquisition: when a single channel is no longer enough
In 2007, acquisition fit in a single box because there was a single way in. Most B2B companies found their customers through Google, via organic search or advertising. The rest was marginal.
Those days are over. Today, acquisition goes through at least three distinct doors:
- Classic Google search.
- Paid advertising.
- A third one that didn’t exist fifteen years ago, visibility in the answers of generative AI (ChatGPT, Perplexity, results generated by Google).
Measuring “acquisition” as a single block no longer makes sense. You need to track the cost and quality of the traffic generated channel by channel.
In B2B, quality matters far more than volume. Cheap traffic that never converts is actually the most expensive of all. That’s where calculating acquisition cost per channel really makes sense, as does a good lead scoring model to prioritize the prospects who truly look like your best customers.
The indicators to watch closely:
- Customer acquisition cost (CAC).
- Conversion rate per channel.
- MQL and SQL volume.
- Each source’s share of the pipeline generated.
Activation: the crux of the matter, especially in B2B
Activation is the moment a user perceives the value of your product for the first time. The famous “aha moment”. The whole difficulty is identifying the precise action that separates those who will stay from those who will leave.
The most telling example is still Slack. The company analyzed the behavior of its customer teams and found a strikingly clear threshold: 2,000 messages exchanged.
Any team that has exchanged 2,000 messages has really tried Slack. And 93% of them are still customers today. (Stewart Butterfield, founder of Slack)
For a team of around fifty people, 2,000 messages represent about ten hours of use. Below that threshold, retention is random. Above it, it shoots up. Slack’s free plan, by the way, gave access to the 10,000 most recent messages until September 2022: enough for every team to get well past that tipping point before paying.
As for benchmarks, an activation rate of 30 to 40% is considered healthy for B2B SaaS. Below 20%, your onboarding is too long or too complex. Above 60%, be wary: your “aha moment” is probably set too low and no longer predicts much.
Two B2B specifics deserve attention:
- First, activation is often measured at the team level rather than the individual level: an account is considered activated when at least three users are active in the first seven days.
- Second, when the product is complex, activation doesn’t always happen in self-service. Superhuman, the premium email client, long required every new customer to take a half-hour one-on-one onboarding call, with each specialist running 8 to 12 a day. A high cost, owned for years, because that’s what turned the trial into a habit. The company then built those lessons into the product, all the way to fully self-serve onboarding.
To push your users to that tipping point, you need to combine two levers: careful customer onboarding and lead nurturing sequences that reactivate those who drop off along the way.
Salesdorado’s tipDon’t guess your “aha moment”. Segment your users still active at 30 days against those who churned, then trace back to the earliest action that clearly separates the two groups. It’s often a counter-intuitive behavior, and that’s your real activation metric.
Retention: the stage that decides everything
If you had to track only one stage in B2B, it would be this one. The reason is mechanical: your revenue is recurring. The slightest churn, at any level, eats away at your compound growth.
Retention is measured properly with cohort retention curves. It’s now the most reliable way to assess your product-market fit: do the customers from a given month stay, or does the curve collapse as the weeks go by?
To act before it’s too late, you need to learn to spot the weak signals of departure. A customer who logs in less and less, or whose sessions get shorter week after week, is a customer slipping through your fingers. The churn rate remains the central indicator, to be complemented by an NPS to capture sentiment.
You also need to clearly distinguish voluntary churn (the customer who decides to leave) from involuntary churn (the one who leaves because of a failed payment or an expired card). The latter is handled with automatic payment reminders, and it sometimes accounts for a surprising share of your losses.
Netflix is a good illustration of the power of retention designed as a product in its own right: its recommendation engine exists first and foremost to give you a reason to come back tomorrow. And when a customer has left you anyway, all is not lost. A good customer win-back strategy lets you recover some of them.
Referral: the viral loop doesn’t really exist in B2B
In B2C, referral takes the form of a viral loop: Dropbox offered free storage for every referral and its user base exploded. Simple and remarkably effective.
In B2B, it doesn’t work like that. Your customers aren’t going to spam their professional network to win two gigs of storage.
Referral takes other forms:
- Customer references.
- Case studies.
- Partnerships.
- Structured referral programs.
- Etc.
The key point is the value of the exchange. A “2 months free” or “50 euros off” is never enough to convince someone to put their reputation on the line. You get referrals when what you give in return carries weight: for example, access to your premium plan at the price of your entry plan for every customer brought in. But let’s be honest, not every product has a natural referral dynamic. In that case, you’re better off admitting it than forcing a mechanism that will never take off.
Revenue: expansion weighs more than acquisition
Last letter… and not the least. In B2B, most long-term revenue doesn’t come from new customers, but from expansion within existing customers.
Here the AARRR framework allows for a formidable financial diagnosis. If your customer lifetime value (LTV) is low, the problem comes either from your monetization, when average revenue per account is too low, or from your retention, when churn cuts the relationship short. In the first case, you work on upselling and cross-selling. In the second, you go back up a notch to retention.
The indicator that sums it all up is net revenue retention (NRR). Above 100%, your existing customers spend more year after year, even without new acquisition. That’s the sign of a healthy machine. To manage all this, rely on clear sales performance indicators rather than on an overloaded dashboard.
The limits of AARRR that too often go unmentioned
No framework is perfect, and the AARRR framework has blind spots you’d better know about before betting everything on it:
- It assumes a linear, sequential journey. Yet in real life, your users skip stages or go through several at the same time.
- It was designed for self-service tech products. Yet in B2B with a buying committee, the user isn’t the buyer and the funnel is anything but linear.
- It favors the quantitative. It captures neither the brand, nor perceived satisfaction, nor customer sentiment, which nonetheless weigh heavily in a B2B buying decision.
- It assumes a referral dynamic that simply doesn’t exist in every model.
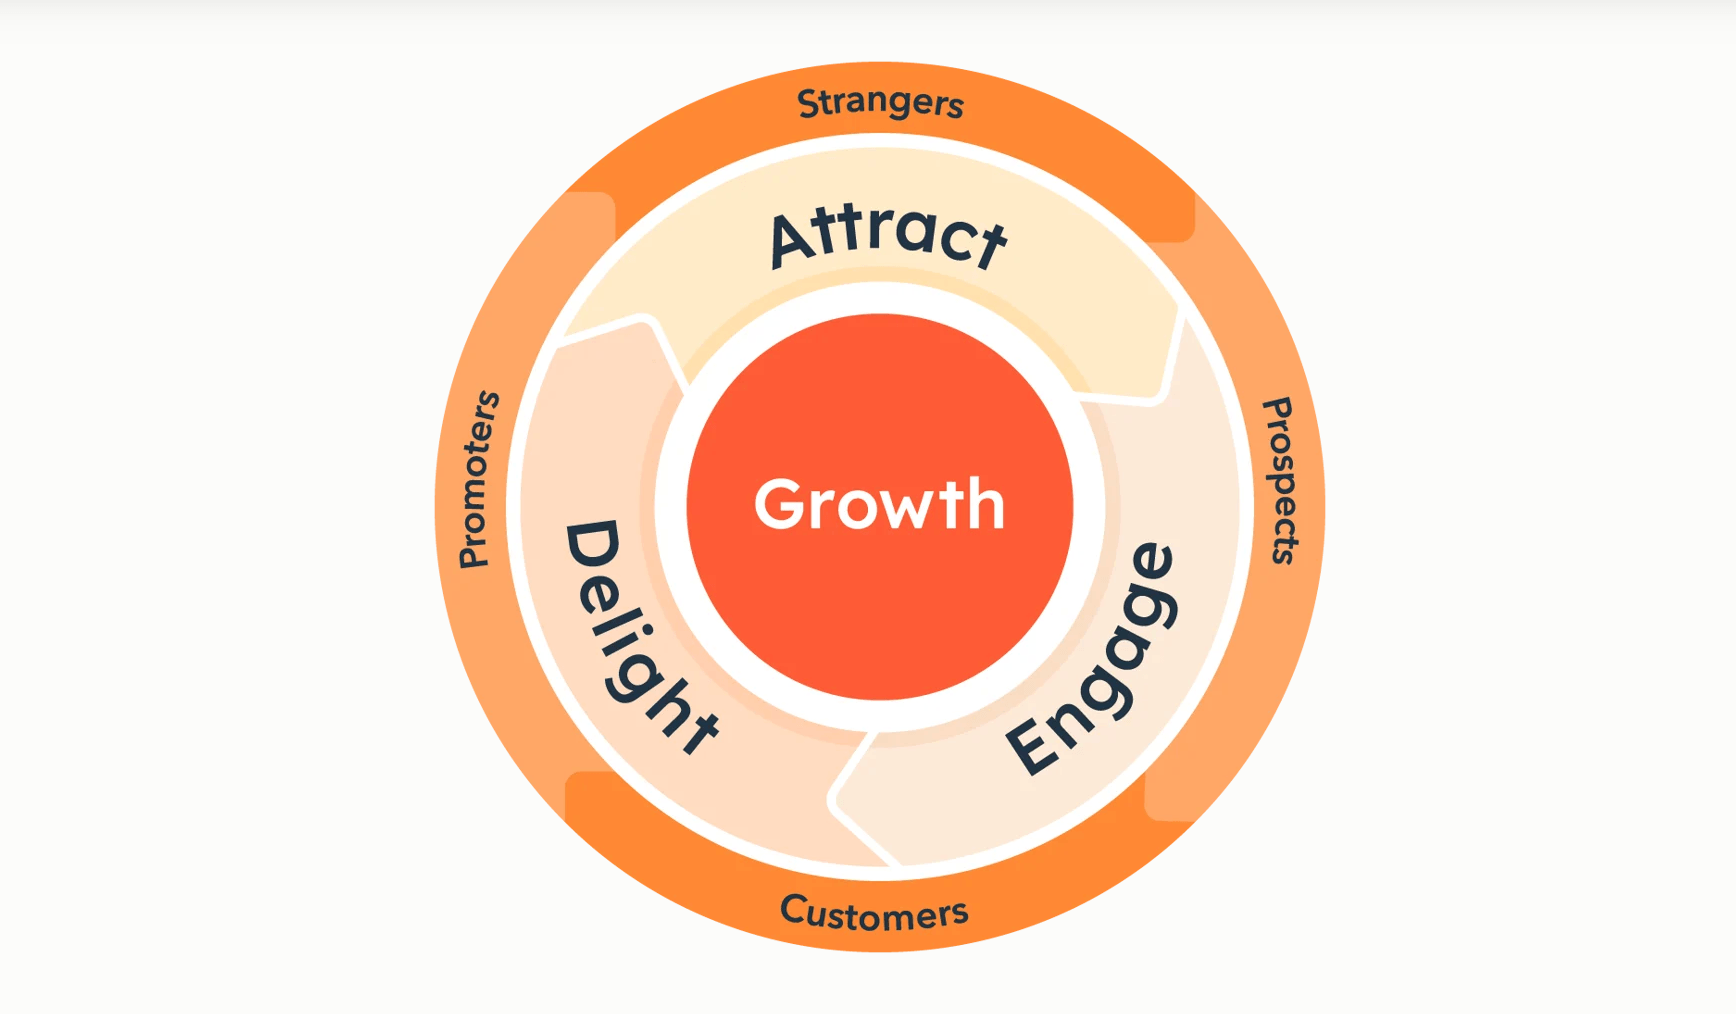
The most interesting workaround is to combine AARRR with a loop-based logic (growth loops) or a flywheel. Where the funnel diagnoses where your users drop off, the loop seeks to create a self-feeding mechanism, where each new user generates others. The best teams don’t choose between the two: they use the funnel to spot the leaks and the loop to build acquisition that compounds over time.
Which tools to track your AARRR metrics?
Theory is worthless without measurement. And for that, you need to call on 2 families of tools:
- For activation and retention, you need an event analytics tool capable of tracking behavior by cohort. The market references are Amplitude and Mixpanel, with Google Analytics 4 for a first approach. If you’re looking to equip yourself without going through Google’s solution, take a look at our comparison of Google Analytics alternatives.
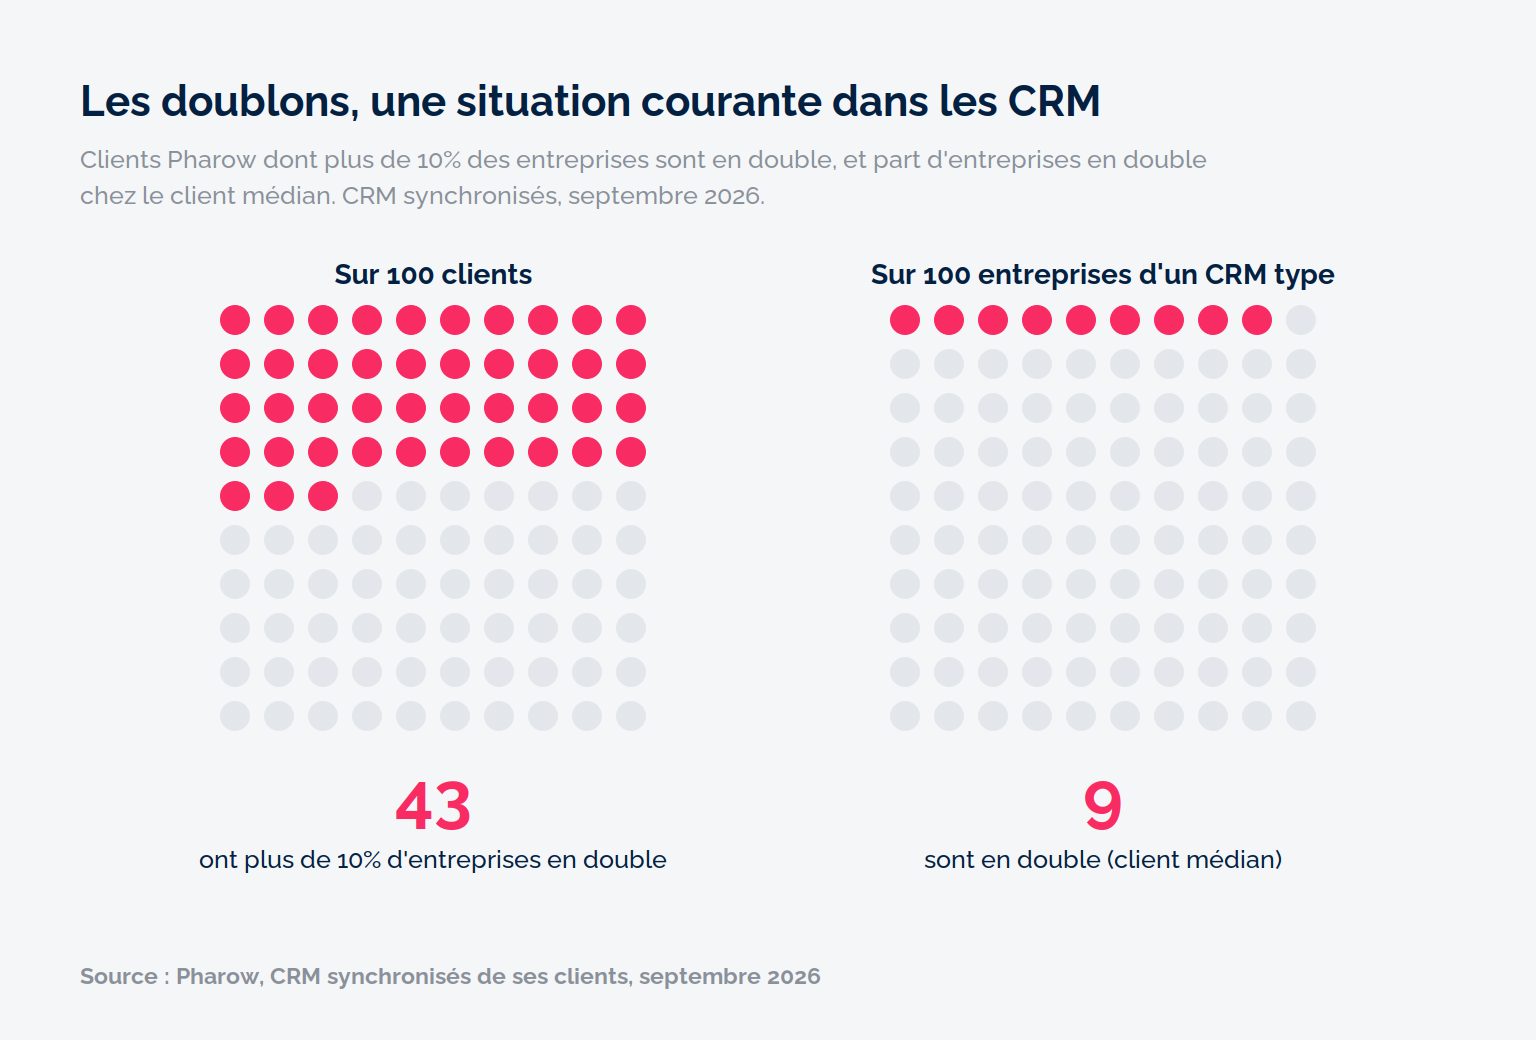
- For B2B, your CRM remains the backbone. It’s the CRM that centralizes the pipeline, acquisition cost by source and expansion tracking. It’s also where you measure the effectiveness of your sales funnel from end to end.
Go further
- Product-led growth: turning your product into a growth machine
- The sales performance indicators to track
- The best growth hacking training courses
Our take on the AARRR framework
AARRR is an excellent diagnostic tool and a poor instruction manual. Remember this distinction, it’s the only one that really matters. The acronym describes your customer’s journey, not the order of your priorities.
Don’t run through the five letters in sequence. Look instead for the stage that drags everything else down, and focus your efforts there. For the vast majority of B2B companies, that stage has a name: retention. That’s where the most profitable growth is hiding, and it’s often the last one people look at.
Salesdorado’s takeDo the exercise this week. Give each of your five stages a score, honestly. The lowest one is your priority project, whatever its position in the acronym. You’ll see: it’s almost never acquisition.
The questions we get over and over.
What does the acronym AARRR stand for?
Acquisition, Activation, Retention, Referral and Revenue. The framework was introduced in 2007 by Dave McClure, founder of 500 Startups, under the name “Startup Metrics for Pirates”: the name comes from the sound of the acronym, close to a pirate’s cry.
Which stage of the AARRR framework should you start with?
There’s no single answer. Without product-market fit, start with activation. With gross retention below roughly 85%, fix it before spending more on acquisition. At 90% and above, you can accelerate acquisition.
What is the difference between AARRR and RARRA?
RARRA uses the same stages in a different order of priority: Retention, Activation, Referral, Revenue, Acquisition. AARRR is better suited to sales-led models, RARRA to product-led models in a saturated market where acquisition is expensive.
What is a good activation rate in B2B SaaS?
A rate of 30 to 40% is considered healthy. Below 20%, onboarding is too long or too complex. Above 60%, the “aha moment” is probably set too low.
What are the limits of the AARRR framework?
It assumes a linear journey, it was designed for self-service tech products, it favors the quantitative and it assumes a referral dynamic that doesn’t exist in every model. It can be combined with a growth loop or flywheel logic.
Which tools should you use to track AARRR metrics?
An event analytics tool for activation and retention, such as Amplitude, Mixpanel or Google Analytics 4, and the CRM for the pipeline, acquisition cost by source and expansion tracking.


What the community says.