



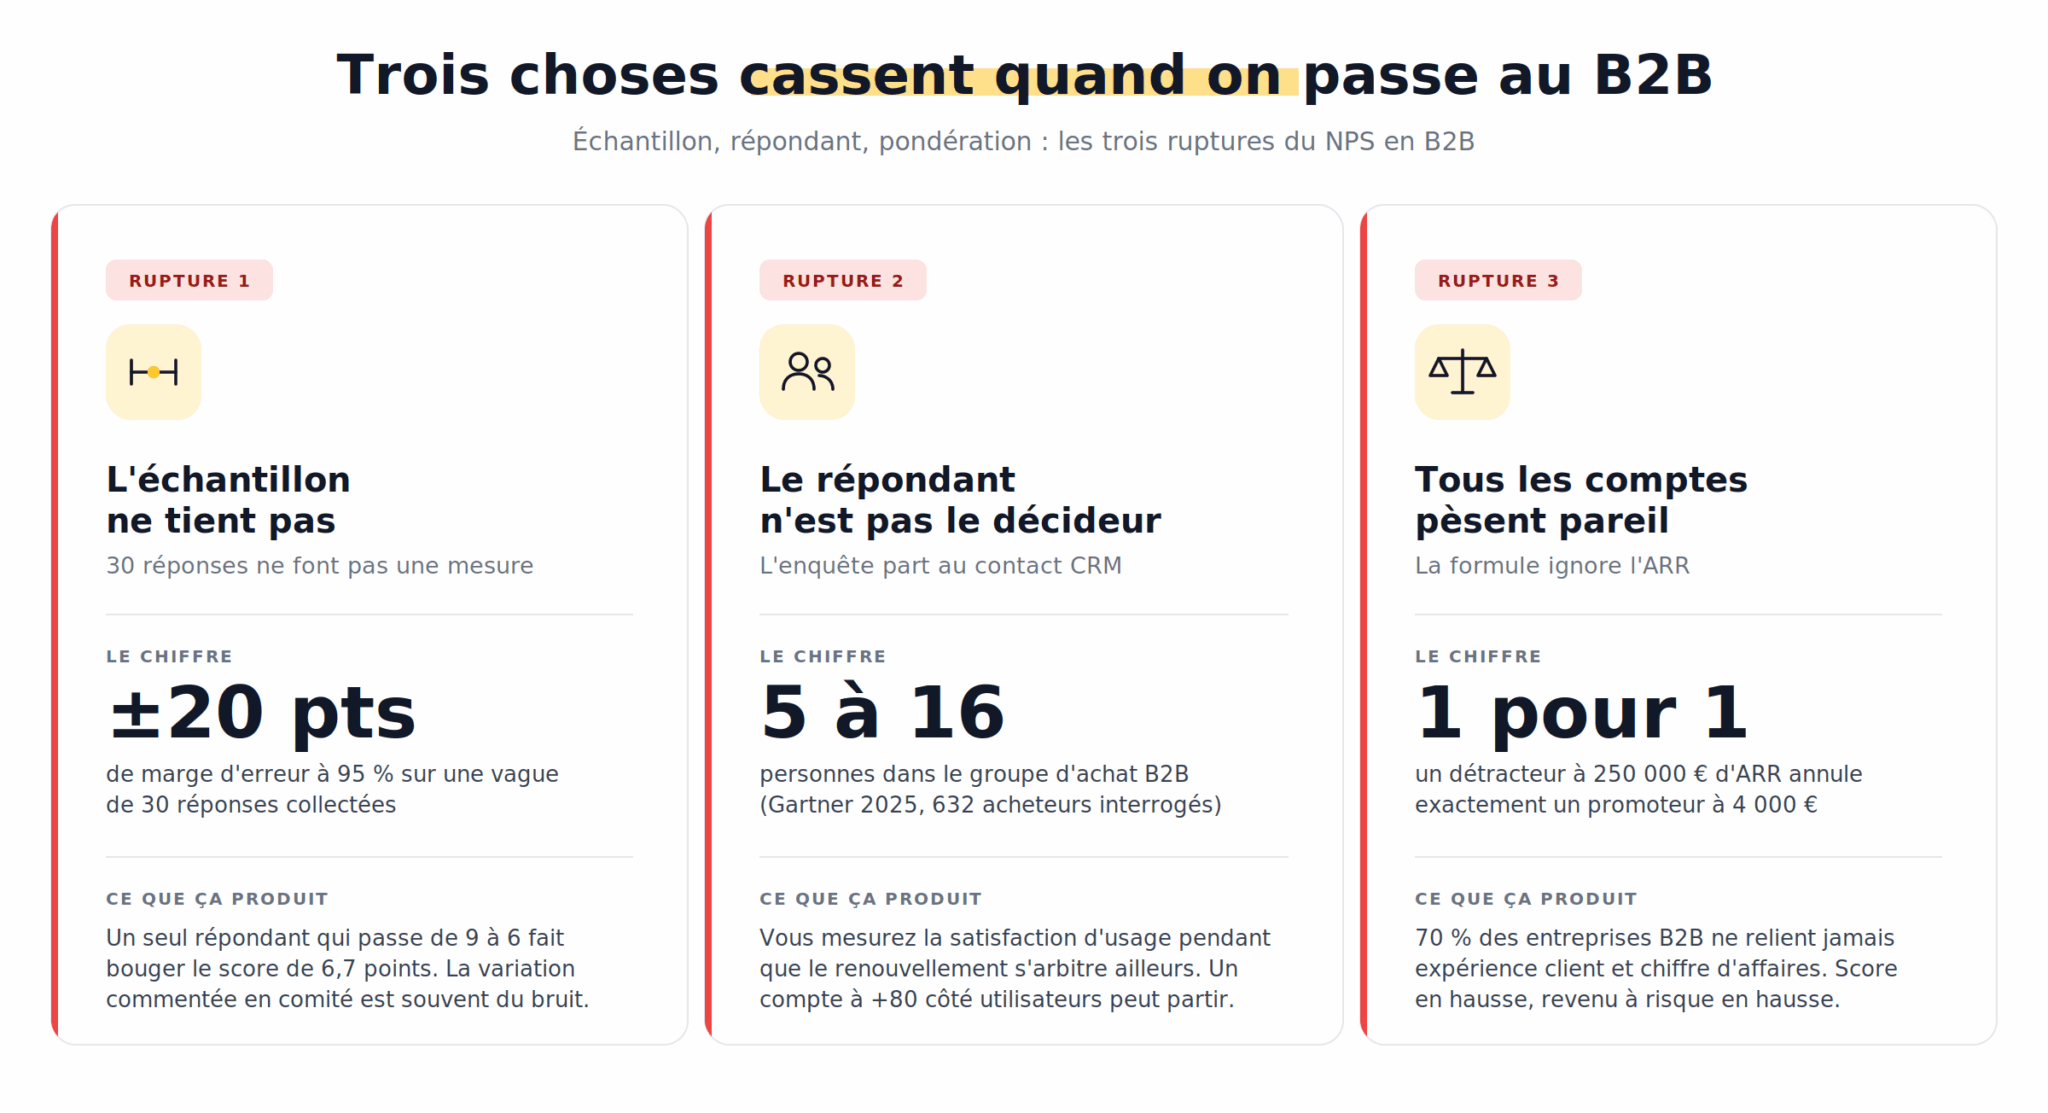
- With 30 responses, an NPS has a margin of error of 20 points: a single customer going from 9 to 6 makes the score lose 6.7 points.
- Always show the response rate and the revenue coverage rate next to the score.
- Survey two contacts minimum per account, three on strategic accounts, and don’t average their scores.
- Never mix relational NPS and transactional NPS. For relational, one wave every six months is enough.
- Handle detractors by revenue at stake: callback within 48 hours on accounts in the top 20% of ARR.
If you’re looking to set up NPS in a B2B company, let’s start with the bad news: with 30 responses, your score has a margin of error of 20 points. A single person switching from promoter to detractor moves it by almost 7 points…
That’s no reason to give up on the Net Promoter Score, but you can’t run it the way you would in B2C. You’ll never survey 5,000 customers, but you can survey 100% of them: it’s the exact opposite of the problem NPS was designed to solve, and that’s your advantage.
In this guide, we go over the calculation, the thresholds and the benchmarks, but above all the protocol that turns an unstable score into a retention system. Here is our complete method.
What is the Net Promoter Score and how do you calculate it?
The Net Promoter Score rests on a single question, scored from 0 to 10: how likely are you to recommend this company to a colleague or a partner?
Responses fall into three categories:
- 9 and 10: promoters
- 7 and 8: passives
- 0 to 6: detractors
The formula ignores passives. NPS equals the percentage of promoters minus the percentage of detractors, and the result ranges from -100 to +100.
An example: out of 80 responses, you get 40 promoters, 28 passives and 12 detractors. That’s 50% promoters minus 15% detractors, so an NPS of +35.
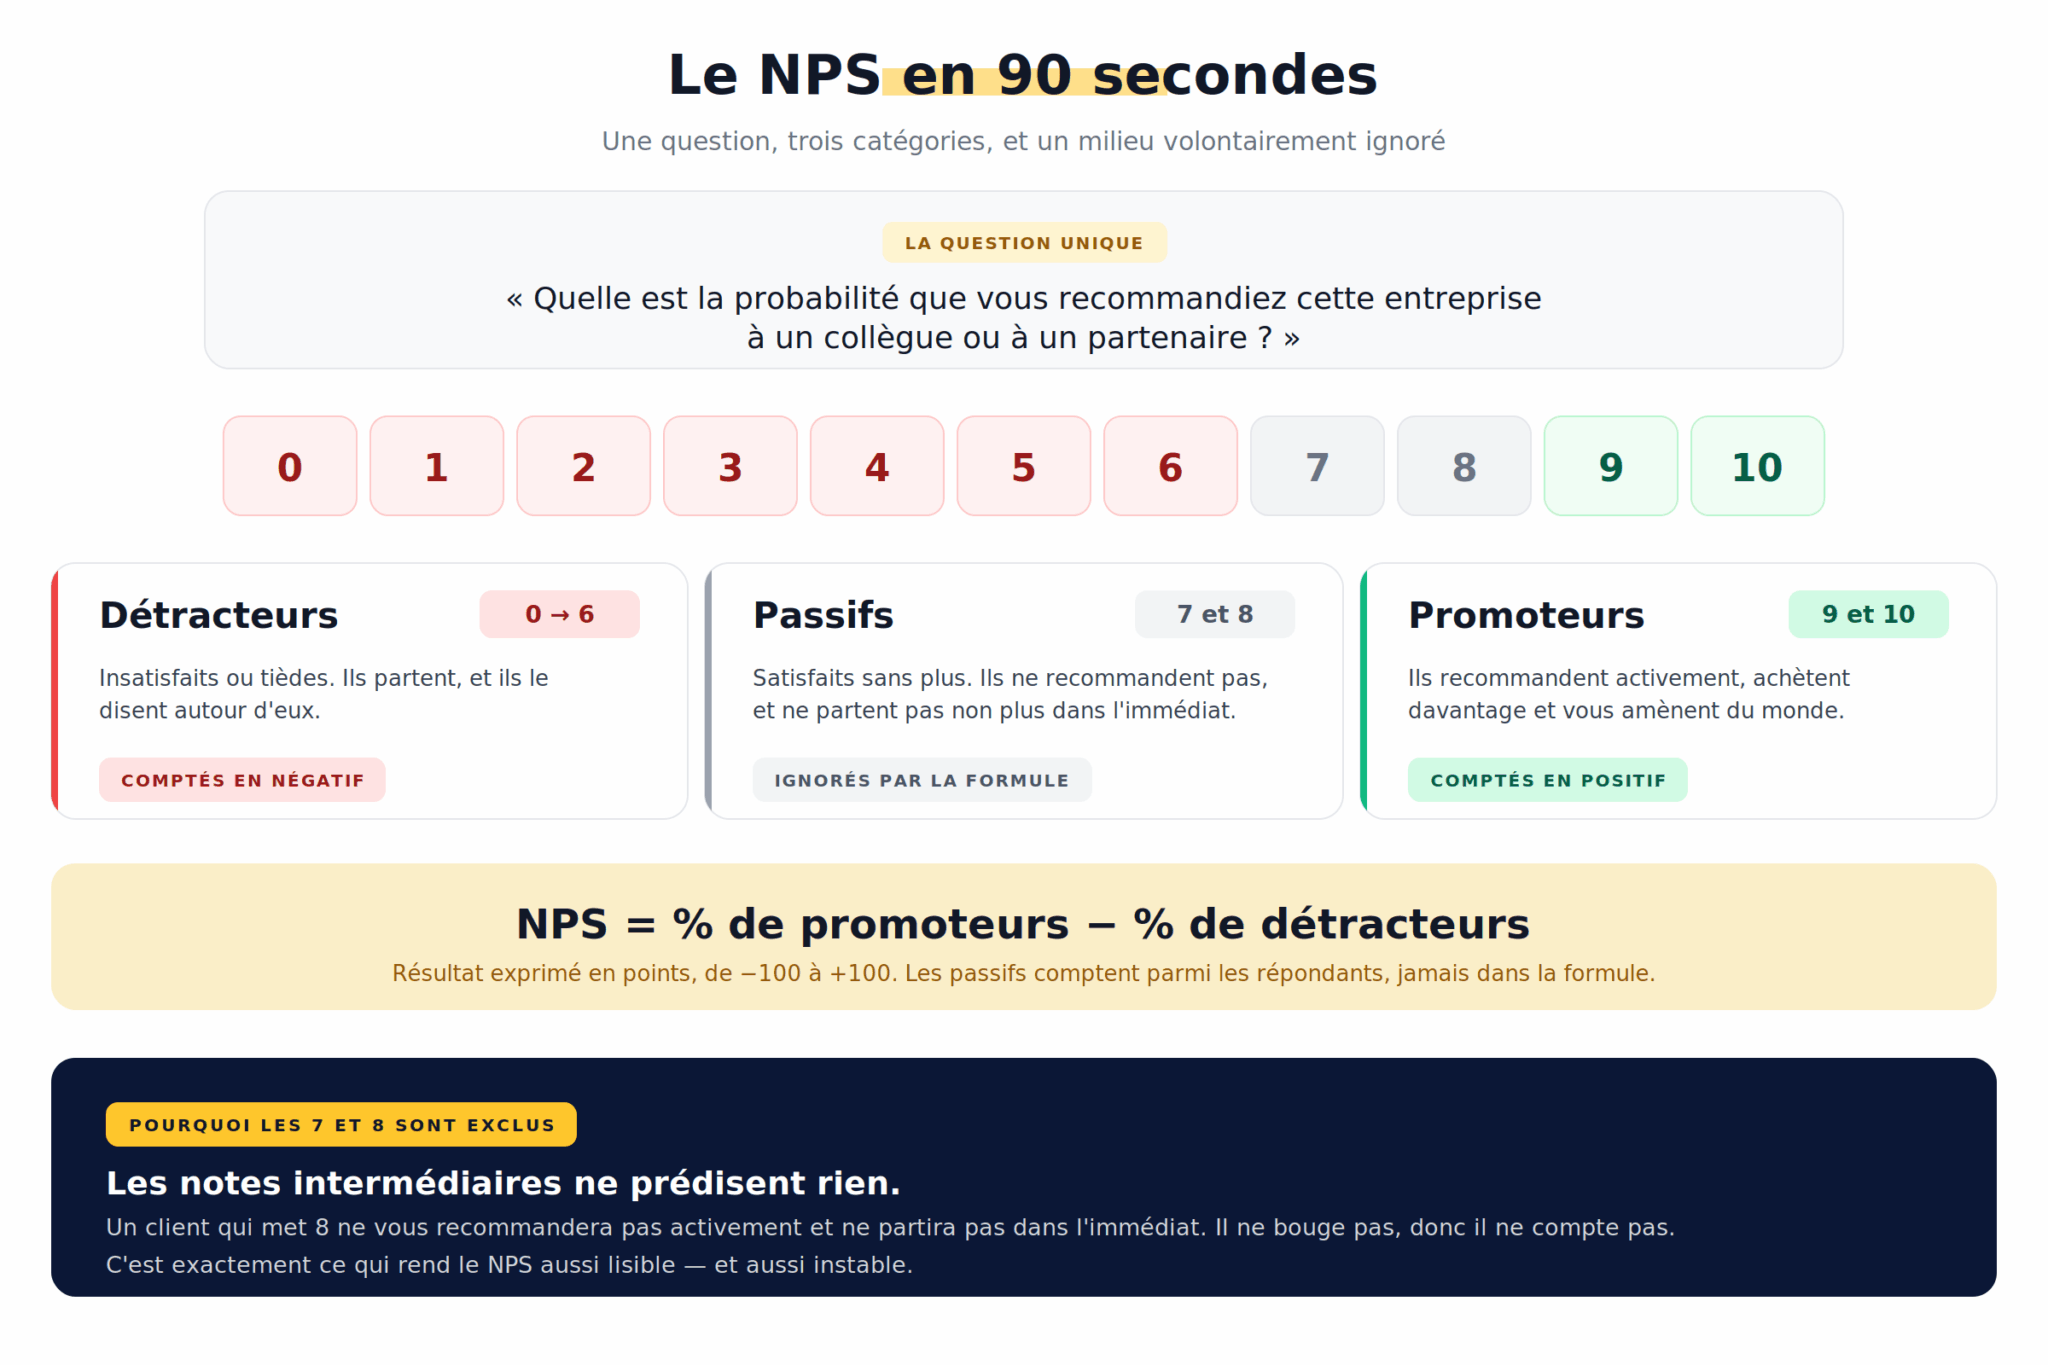
The point most articles skip over is why the middle scores are excluded. It’s not a methodological whim. Fred Reichheld found that 7s and 8s predicted nothing: a customer who gives you an 8 won’t actively recommend you, and won’t leave right away either. They don’t move, so they don’t count in the calculation.
This exclusion has a direct consequence you’ll feel very quickly. NPS is a difference between two percentages, calculated on only part of your respondents. That’s what makes it so easy to read. It’s also what makes it so unstable.
Why NPS works poorly in B2B: 3 methodological limits
NPS was born in December 2003, in an article by Fred Reichheld published by the Harvard Business Review under the title “The One Number You Need to Grow”. Reichheld was then a consultant at Bain & Company, and his work focused on mass markets: airlines, retail banks, telecom operators. Sectors where surveying 3,000 people is no problem at all.
In B2B, you may have 60 customers. Or 400. Rarely 50,000. Three things break when you transpose the mechanism without adapting it.
Break 1: your sample is too small for the score to hold
An NPS is never a measurement, it’s an estimate. Like any poll, it comes with a margin of error that depends on the number of responses collected relative to the size of your customer base.
We ran the calculation on a typical B2B distribution, namely 48% promoters, 42% passives and 10% detractors, which gives an NPS of +38. 95% confidence interval.
| Customer base | Responses collected | Response rate | NPS margin of error |
|---|---|---|---|
| 120 | 30 | 25% | ± 20 points |
| 300 | 40 | 13% | ± 19 points |
| 120 | 50 | 42% | ± 14 points |
| 800 | 100 | 12% | ± 12 points |
| 300 | 200 | 67% | ± 5 points |
| 60 | 55 | 92% | ± 5 points |
Read the fourth row. A company with 800 customers that collects 100 responses, which is already a good result in B2B, shows a score of plus or minus 12 points. Its NPS of +38 actually sits somewhere between +26 and +50.
Another way of looking at the same thing: in a wave of 30 responses, a single respondent going from 9 to 6 is enough for the score to lose 6.7 points. One customer in a bad mood on survey day triggers a crisis meeting.
The costly mistakeTying a variable bonus to quarterly NPS when you collect fewer than a hundred or so responses amounts to paying people for chance. Worse: it mechanically pushes teams to cherry-pick the accounts they survey and to ask for the score face to face, which finishes off whatever accuracy the measurement had left. If you want a numerical target on the subject, set it on the response rate. That one genuinely depends on the teams’ work.
Break 2: the person who answers isn’t the person who signs
In B2C, the user and the payer are the same person. In B2B, almost never.
The survey Gartner carried out in 2025 among 632 B2B buyers puts the size of buying groups at between 5 and 16 people, spread across up to four different functions. Forrester, for its part, puts forward an average of 13 stakeholders per purchase decision.
Who do you send your survey to? The main contact recorded in your CRM. In other words, nine times out of ten, the day-to-day user. The one who knows the tool, who has a well-argued opinion and who has no power over the renewal.
So you’re measuring usage satisfaction while the decision is made elsewhere, by a CFO who has never opened the application and who decides on cost. These two realities regularly diverge. An account showing +80 on the user side can very well leave because the sponsor changed jobs and nobody internally is defending the budget line anymore.
Break 3: the formula treats all your customers equally
In the NPS calculation, a detractor worth €250,000 in ARR cancels out exactly one promoter worth €4,000. One for one.
In B2C, this equality can be defended. In B2B, it’s absurd. In most portfolios, 20% of accounts carry most of the revenue, and these large accounts often have tougher requirements, so harsher scores. You can perfectly well show a rising score while revenue at risk is increasing.
That’s actually the main finding of the industry barometers: 70% of B2B companies never link their customer experience data to their revenue. They manage a score, not a risk.
In B2B, the real lever isn’t the NPS score, it’s coverage
Go back to the margin of error table and look at the last two rows.
A base of 300 customers with 200 responses gives a score of plus or minus 5 points. So does a base of 60 customers with 55 responses. These two companies have a more reliable NPS than a B2C player that collected 400 responses out of 100,000 customers.
That’s the reversal to keep in mind. As soon as you survey a significant share of your total population, uncertainty collapses. Statisticians call this the finite population correction. Translated into operational language: the small size of your customer base, which seemed to be your handicap, becomes your advantage as soon as you push up the response rate.
Except nobody does it. The average response rate to NPS surveys in B2B hovers around 12.4%, with a range from 4.5% to nearly 40% depending on the company. Mature programs, for their part, exceed 60%.
The two figures to always show next to the score
An NPS delivered on its own is incomplete information. Always pair it with these two indicators:
- The response rate, expressed as a percentage of the contacts surveyed. It’s what determines the margin of error, and therefore the credibility of the figure.
- The revenue coverage rate, meaning the share of your total ARR represented by the accounts that responded. It’s the more useful of the two, and almost nobody calculates it.
An NPS of +62 obtained from 12 accounts that make up 18% of your revenue tells you nothing about the remaining 82%. And in B2B, an account that stops responding isn’t a neutral account. It’s often the first symptom of disengagement, well before the issue reaches support or a portfolio review.
How to raise the response rate
- Send the survey from the personal address of the customer success manager or the salesperson in charge of the account, never from a generic address.
- Stick to two questions: the score, then “what would justify one more point?”.
- Build the request into the quarterly check-in rather than sending it as a cold mailing.
- Follow up by phone with strategic accounts that have stayed silent at D+10.
- Announce what you’ll do with the feedback, then actually do it.
The last point is the one most often neglected, and it’s the one that sinks the second wave. A customer who took five minutes last year and never heard back won’t respond this year.
B2B NPS survey: who to survey and how often?
Two decisions to make.
How many contacts per account
The rule we apply: two contacts minimum per account, three on strategic accounts. The day-to-day user, the operational manager who champions the subject internally and the budget sponsor when there is one.
It’s heavier to administer, obviously. It’s also the only way to spot the gap that kills, the one between a delighted user and a lukewarm sponsor. That gap is a far more reliable churn signal than the account’s average score.
Watch out for a common mistake: don’t average the contacts of the same account before consolidating your score. You’d be crushing precisely the information you’re interested in. Keep both levels of reading: NPS per respondent for the overall trend, the gap within the account as a risk indicator.
Relational NPS or transactional NPS
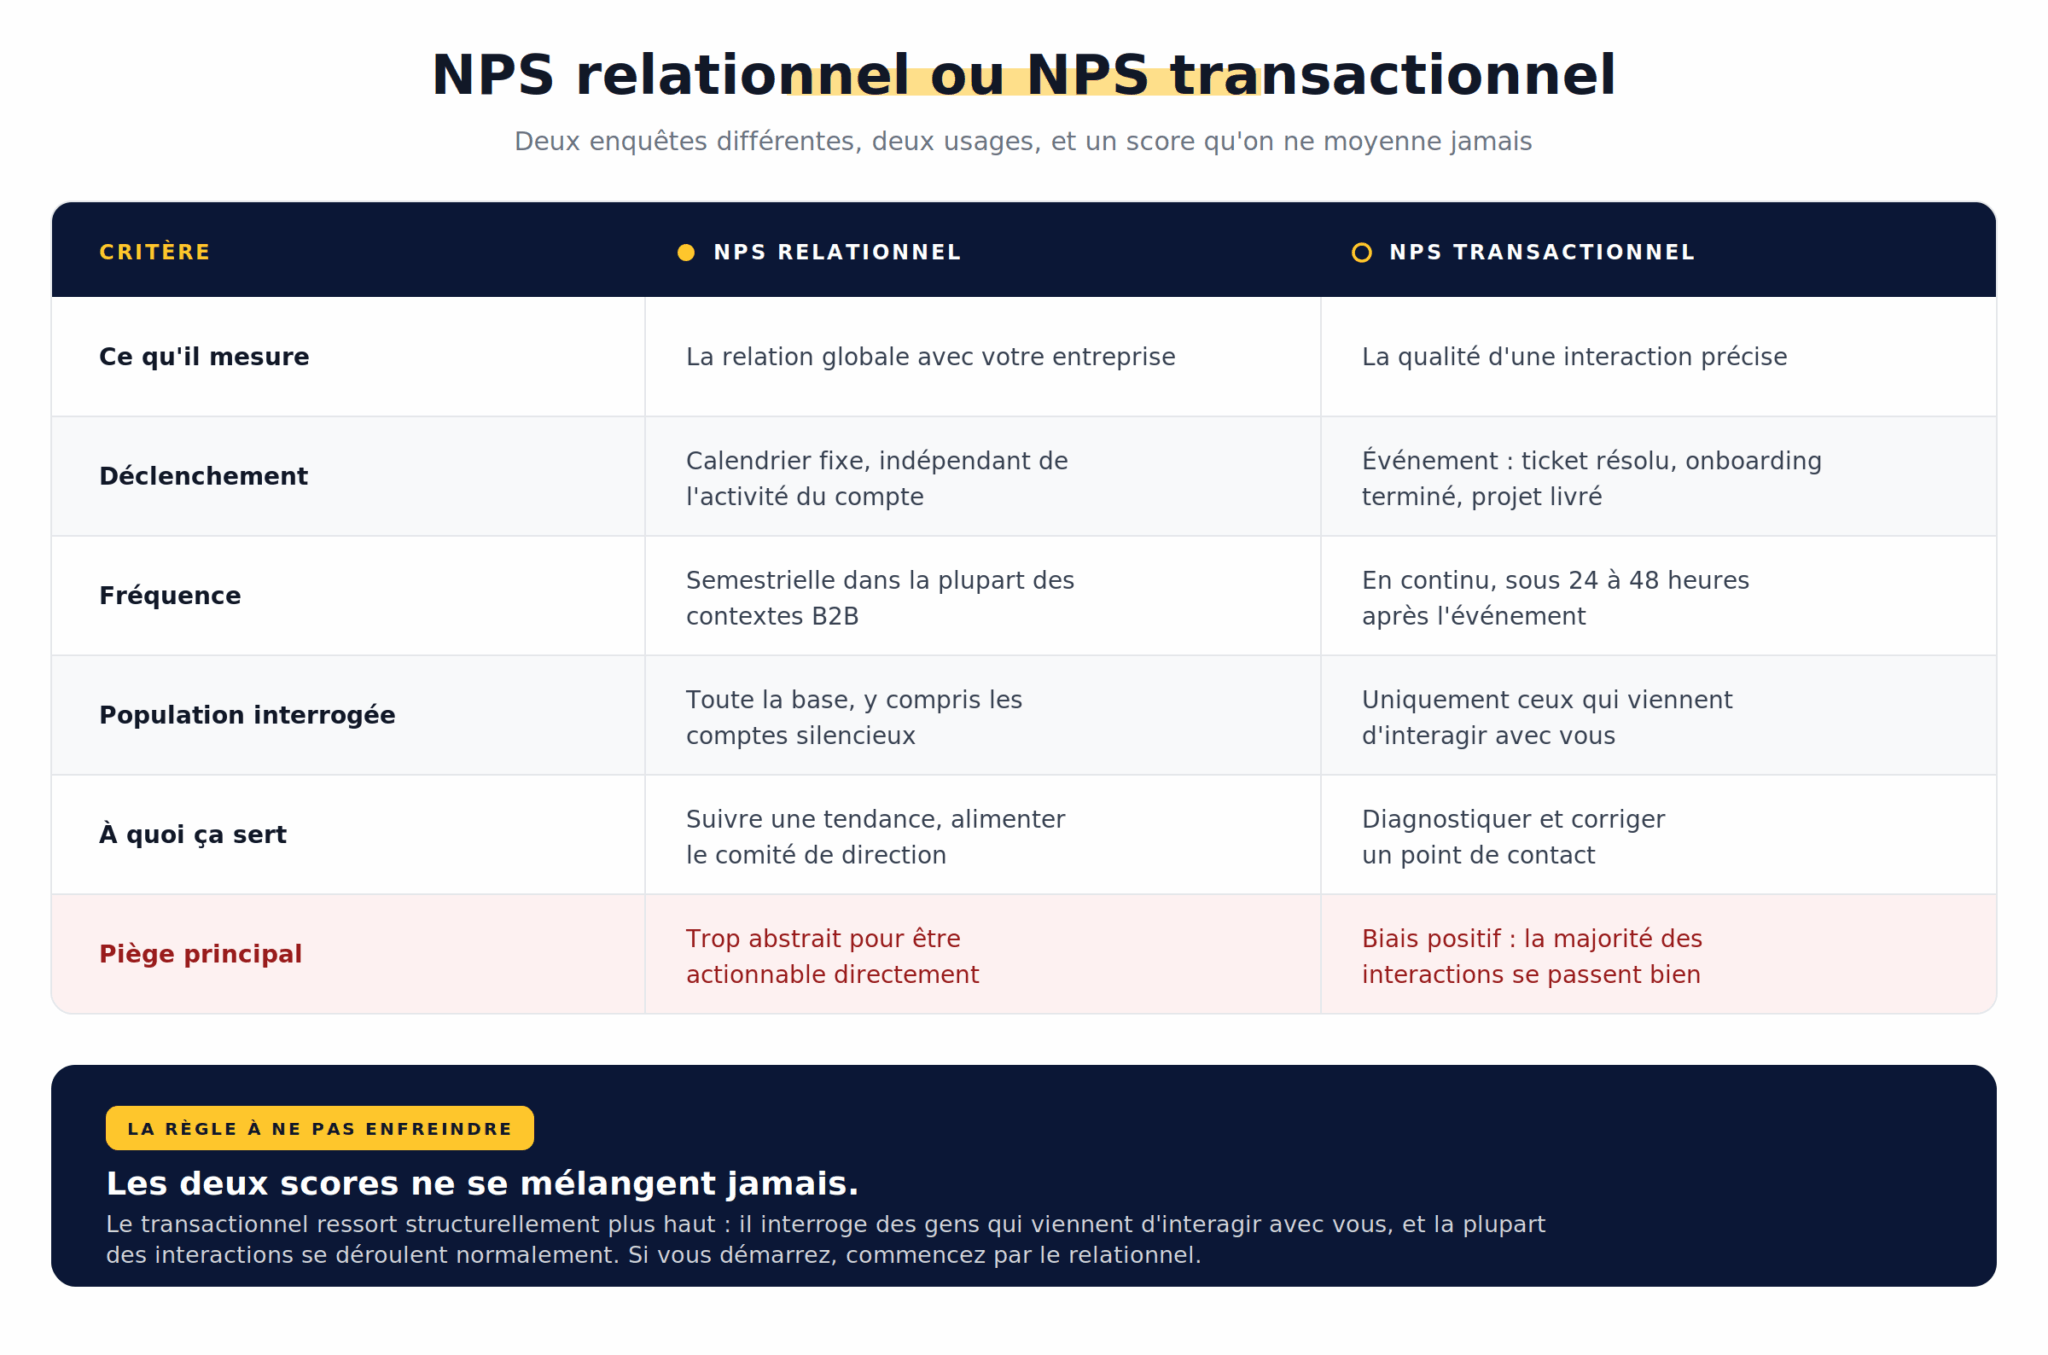
| Relational NPS | Transactional NPS | |
|---|---|---|
| What it measures | The overall relationship with your company | The quality of a specific interaction |
| Trigger | Fixed schedule, independent of account activity | Event: ticket resolved, onboarding completed, project delivered |
| Frequency | Every six months in most B2B contexts | Continuously, within 24 to 48 hours of the event |
| Population surveyed | The whole base, including silent accounts | Only those who have just interacted with you |
| What it’s for | Tracking a trend, feeding the executive committee | Diagnosing and fixing a touchpoint |
| Main pitfall | Too abstract to be directly actionable | Positive bias: most interactions go well |
The two scores never mix. Transactional NPS comes out structurally higher, because it surveys people who have just interacted with you and most interactions go normally. Averaging them would produce a figure that means nothing.
If you’re starting out, begin with relational. It will tell you which touchpoints really matter to your customers, and you can then graft transactional NPS onto them where it’s worth it.
The schedule and its pitfalls
Three moments to avoid:
- Right after a ticket is resolved, if you’re after a relational score. You’ll measure the quality of support, not of the relationship.
- Three weeks before a renewal. The customer understands the intention perfectly well and answers strategically, sometimes while preparing a negotiation.
- During onboarding. A B2B customer’s perception doesn’t settle until after several months of real use.
For relational NPS, a six-monthly cadence is enough in the vast majority of B2B contexts. Quarterly only makes sense if your base is large enough for the variation to rise above statistical noise, which is rare.
What is a good NPS in B2B? Benchmarks by industry
Let’s start with the figures.
The largest dataset available today is Survicate’s 2025 NPS benchmark, built on 5.4 million responses collected from 599 companies.
It puts the median across all industries at 42. When you separate business models, the gap becomes clear: 49 on the B2C side versus 38 on the B2B side. In software, the gap widens further, with 47 in B2C versus 29 in B2B.
The industry medians below come from the same benchmark.
| Industry | Observed median NPS |
|---|---|
| Manufacturing and production | 65 |
| Healthcare | 61 |
| Agencies and consulting firms | 59 |
| Professional services | 50 |
| Fintech | 46 |
| Media | 40 |
| B2B median, all industries | 38 |
| Wholesale and distribution | 36 |
| Telecoms | 31 |
| B2B software | 29 to 41 depending on the benchmark |
Now, the caveat. All these medians come from a single dataset, and changing the source changes the result.
Take B2B software: Survicate puts the median at 29, Retently at around 41, and Userpilot’s analysis of 229 SaaS vendors comes out in the mid-30s.
Twelve points apart for the same industry, in the same year. It isn’t a measurement error, it’s a difference in method: different panels, different response rates, different scopes, and a good share of self-reported scores that nobody has ever audited.
Salesdorado’s takeThe only truly useful benchmark is your own previous wave, provided you’ve kept the same question, the same surveyed population and the same channel. A score that goes from +34 to +41 with an identical method and a stable coverage rate teaches you something. The same score compared with an industry median published by a survey software vendor teaches you nothing at all. Use benchmarks to set an order of magnitude when you start, then forget them.
How to use the results of an NPS survey
The score isn’t the deliverable. It’s the trigger. What creates value is what you do in the 48 hours following a response.
The short loop and the long loop
Two mechanisms, two timeframes:
- The short loop handles the individual case. A detractor responds, the account owner calls them back within 48 hours. Not an automated thank-you email, a call. The goal isn’t to push the score back up, it’s to understand and to show you’ve listened. Programs that keep this commitment regularly turn detractors into references. It’s the best return on investment of an NPS program.
- The long loop handles the cause. When the same irritant comes up at eight accounts, it’s no longer a customer relationship issue. It’s a product, pricing or process issue. It leaves the customer success remit and goes to committee, with the amount of ARR at stake attached. That figure is what gets decisions made, not the number of mentions.
Prioritize by revenue at stake, not by volume
Here’s how we organize the handling of a wave:
- Detractors in the top 20% of ARR: callback within 48 hours by the account owner, written action plan shared with the customer within a week.
- Detractors in the rest of the portfolio: personalized email from the customer success manager, then a call if the response warrants it.
- Passives: these are your most fragile and most ignored accounts. A passive is one competing offer away from leaving. Treat them as a segment in their own right, with an upsell or re-engagement angle depending on the case.
- Promoters: request for a referral, a testimonial or a customer review, but never in the same email as the thank-you. Let a week go by.
Promoters are the only place where NPS generates revenue directly. A referred customer costs significantly less to acquire than a cold prospect, which lightens your acquisition cost, and stays longer.
The AI prompt for working through your verbatims
The score is 5% of the value of an NPS survey. The verbatims are everything else. And that’s precisely what nobody deals with, because reading 140 open comments and sorting them properly takes a day nobody has.
Here’s the prompt you can use. What sets it apart: it sorts by revenue at stake rather than by number of mentions, which completely changes the priorities that come out of it.
The Salesdorado prompt to copy and pasteYou are a customer success analyst at a B2B company. I’m giving you the verbatims from our latest NPS survey. Each line contains: account name, annual ARR in euros, NPS score from 0 to 10, verbatim.
[PASTE YOUR DATA HERE]
Step 1. For each verbatim, produce a table row with: the account, the score and its category (promoter, passive or detractor), the ARR, the main theme chosen only from this list (product, price, support, onboarding, performance, integrations, sales relationship, other), a sub-theme of 5 words maximum worded with the customer’s own words, a severity from 1 to 3 (1 = irritant, 2 = obstacle to use, 3 = explicit or implicit reason for cancellation), and a recommended action in one sentence in the imperative.
Step 2. Then produce three summaries:
- The themes ranked by cumulative ARR at stake, and not by number of mentions. For each one, give the total amount and the number of accounts concerned.
- The accounts to call back as a priority this week, with for each one the opening angle of the call in one sentence.
- The promoter verbatims that can be used as a case study or a referral, with the exact quote to reuse.
Constraints: don’t invent any information that isn’t in the verbatims. If a verbatim is too vague to be classified, mark it “to be requalified by phone” rather than guessing. Don’t add any comment outside the tables and the three summaries requested.
The result isn’t a definitive analysis, it’s a first sort. You save the day of manual classification and you walk into the portfolio review with amounts, not impressions.
Connecting NPS to the CRM
An NPS that lives in a spreadsheet triggers nothing.
The minimum viable setup comes down to two properties on the company record in your CRM: the latest NPS score and the date of the latest response, fed automatically. From there, you create a workflow that generates a task assigned to the account owner as soon as a score of 6 or less comes in. And an alert when an account hasn’t responded for two consecutive waves.
Most CRMs and customer success tools can do this natively or through a connector. It’s not a tooling issue, it’s a discipline issue. As long as the score doesn’t create a task assigned to someone with a date, it stays a slide.
The limits of NPS and the indicators that complement it
Let’s be clear about it: NPS doesn’t predict your growth.
Yet that was the original promise, summed up in the title of the 2003 article. It has never been confirmed. In 2007, Timothy Keiningham and his co-authors published in the Journal of Marketing a replication of Reichheld’s study, on a larger sample and with a stricter methodology.
Their conclusion: NPS doesn’t predict growth any better than other satisfaction indicators. The article received the Marketing Science Institute’s H. Paul Root award, which didn’t stop NPS from becoming the global standard.
More recently, several studies have shown that NPS correlates poorly with gross retention, meaning the pure renewal rate. It performs much better on net retention, the kind that includes expansion. Which makes sense when you think about it: a promoter isn’t someone who stays, it’s someone who buys more and brings people to you.
The most interesting part is that Reichheld himself published a correction. In 2021, in an article entitled Net Promoter 3.0, he acknowledges that self-reported, unaudited scores have become vanity statistics, and proposes a complementary metric drawn from accounting rather than surveys: the Earned Growth Rate. Its formula combines net revenue retention and the share of growth coming from customers acquired through referrals.
Look at that formula. It’s a B2B metric. Twenty years after inventing NPS, its author proposes complementing it with what B2B companies already measure.
| Indicator | What it measures | When to look at it |
|---|---|---|
| Relational NPS | Intent to recommend, and therefore the potential for word-of-mouth growth | Twice a year, with its margin of error and its coverage rate |
| CSAT | Immediate satisfaction with a given interaction | Continuously on support and project delivery |
| CES | The effort required from the customer to get what they want | On high-friction journeys: onboarding, billing, migration |
| Gross revenue retention | Revenue retained excluding expansion, and therefore the real leakage | Every month, it’s the toughest indicator of the lot |
| Net revenue retention | Revenue retained, expansion included | Every month, read alongside NPS |
| Share of revenue from referrals | Growth genuinely earned rather than bought | Once a year, by asking every new customer how they heard about you |
We’re not suggesting you abandon NPS. It has a quality few indicators share: it fits in one question, it’s understood in three seconds in an executive committee and it gives you a pretext that can be industrialized to open a conversation with a customer you wouldn’t otherwise have called. That’s already a lot.
But treat it for what it is. A trigger, with a margin of error, to be shown with its coverage rate and read alongside harder indicators. The day your NPS no longer serves to comment on a curve but to decide who to call back on Monday morning, it will have started to be useful.
Going further
- 7 concrete actions to measure customer satisfaction, to place NPS among the other listening programs.
- Churn rate: definition, calculation and levers, the hard indicator to cross-check systematically with your scores.
- B2B review management, to turn the promoters you’ve identified into usable social proof.
- Customer win-back, when a detractor has already left and there’s still a card to play.
The questions we get over and over.
How is the Net Promoter Score calculated?
You ask a question scored from 0 to 10 on how likely people are to recommend the company. 9s and 10s are promoters, 7s and 8s passives, 0 to 6 detractors. NPS is the percentage of promoters minus the percentage of detractors, from -100 to +100. Out of 80 responses with 40 promoters and 12 detractors, it comes to +35.
Why is NPS unreliable in B2B?
Because the sample is often too small for the score to hold, because the person answering is the user and not the one who decides on the renewal, and because the formula counts an account worth €250,000 in ARR the same as an account worth €4,000.
What is a good NPS in B2B?
Survicate’s 2025 benchmark puts the B2B median at 38, versus 49 in B2C. It varies by industry, from 65 in manufacturing to 29 in B2B software, and by source. The only truly useful benchmark remains your own previous wave, measured with the same method.
Who should you survey in a B2B NPS survey?
Two contacts minimum per account, three on strategic accounts: the day-to-day user, the operational manager who champions the subject internally and the budget sponsor when there is one. The gap between a delighted user and a lukewarm sponsor is a churn signal.
How often should you run an NPS survey in B2B?
For relational NPS, a six-monthly cadence is enough in the vast majority of B2B contexts. Transactional NPS is measured continuously, within 24 to 48 hours of an event such as a resolved ticket or a delivered project.
Which indicators should complement NPS?
CSAT for satisfaction with an interaction, CES for the effort required from the customer, gross and net revenue retention, and the share of revenue coming from referrals.


What the community says.